Hate speech and social acceptance of migrants in Europe: Analysis of tweets with geolocation
Abstract
Hate speech against vulnerable groups is acknowledged as a serious problem for integration and respect for the social diversity existing within the territory of the European Union. The growth of this type of discourse has been supported by the expansion of social media, which have been proven to act as a mechanism for the propagation of crimes against targets such as migrants and refugees, one of the main affected groups. That is why we have conducted the first European study of the social acceptance of migrants and refugees by studying the presence of hate speech. The research is based on the perspective of the theories of intergroup contact and mediated intergroup contact. The methodology includes large-scale longitudinal analysis (2015-2020) of online hate speech on Twitter (N=847,978) and its contrast with existing official indicators. The results suggest that personal intergroup contact is positively corretaled with the support of the local population towards migrants and refugees but mediated intergroup contact is not correlated with hate speech on Twitter. We found evidence that those regions where the support for foreigners was higher, there was a lower level of hate speech on Twitter. This is an advance in the study of hate speech by territories and can help in the formulation of action strategies.
Keywords
Inmigration, refugees, attitude, hate speech, big data, Twitter
Palabras clave
Inmigración, refugiados, actitud, discurso del odio, big data, Twitter
Resumen
El discurso de odio contra públicos vulnerables es reconocido como un grave problema para la integración y el respeto a la diversidad social dentro de la Unión Europea. El aumento de este tipo de discurso se ha visto reforzado con la expansión de las redes sociales, donde se ha demostrado que actúan como mecanismo de propagación de delitos contra colectivos como los migrantes y refugiados, uno de los principales afectados. Por ello se aborda el desarrollo del primer estudio europeo de la aceptación social de migrantes y refugiados mediante el estudio de la presencia de discurso de odio. La investigación se basa en la perspectiva de la teoría del contacto intergrupal y el contacto intergrupal mediado. La metodología incluye el análisis longitudinal (2015-2020) a gran escala del discurso de odio en línea en Twitter (N=847.978) y el contraste con indicadores oficiales existentes. Los resultados apuntan a que el contacto intergrupal personal está correlacionado positivamente con el apoyo de la población hacia migrantes y refugiados, pero el contacto intergrupal mediado no está correlacionado con la disminución del discurso de odio. Encontramos evidencia que muestra que en aquellas regiones en las que el apoyo al colectivo era mayor existía un menor nivel de discurso de odio en Twitter. Esto supone un avance en el estudio del discurso de odio por territorios y puede ayudar en el planteamiento de estrategias de actuación.
Keywords
Inmigration, refugees, attitude, hate speech, big data, Twitter
Palabras clave
Inmigración, refugiados, actitud, discurso del odio, big data, Twitter
Introduction and background
Hate speech has alarmingly permeated our society and social media have become the most suitable means of propagation. The number of potentially offensive and dangerous messages against stigmatized groups has increased as a result of the COVID-19 health and economic crisis. The pandemic “not only took human lives, but it reinforced existing problems, and hit harder on otherwise vulnerable minorities” (Bayer & Bárd, 2020: 16-17). So far, there is no single definition for hate speech due to (i) the legal and ethical considerations and implications involved; and (ii) the subjective nature of “hate,” i.e., a sentiment opens to interpretation with blurred boundaries (Cabo-Isasi & García-Juanatey, 2017). United Nations (UN) (2019) defines hate speech as “any kind of communication in speech, writing or behavior, that attacks or uses pejorative or discriminatory language with reference to a person or a group [...] based on their religion, ethnicity, nationality, race, color, descent, gender or other identity factors.”
The definition of migrant encompasses all those people who move from one place to another, either within their own country or crossing international borders, for multiple reasons. Countries have different processes to determine whether migration is legal or not. Generally, people who have applied for permission to reside in another nation through established procedures and are accepted are considered "legal migrants." On the other hand, there are undocumented immigrants, also referred as "illegal immigrants", who cross to another country without knowledge or acceptance of their movement by the host country. There are many reasons why people make these dangerous decisions, such as longing for a better life for themselves or their children, fear for their lives, fleeing extreme poverty in their country, or reuniting with family members who have already resettled in the country. Differently, a "refugee" is defined as someone who, due to a well-founded fear of being persecuted for reasons of race, religion, nationality, membership to a particular social group or political opinion, is outside their country of nationality and is unable, or is unwilling out of fear, to avail themselves to the protection of that country; or who, without having a nationality and being outside the country of their former habitual residence as a result of such events, cannot or, due to such fear, is not willing to return to it (United Nations High Commissioner for Refugees UNHCR, 1951). In practice, hate speech based on xenophobia or racism is similarly directed towards migrants or refugees.
Immigration ranks third among European citizens’ concerns, right after their personal economic situation and government finance. Immigrants and refugees are some of the most affected groups by hate speech. In fact, hate speech towards these vulnerable groups is relevant to the point that some scholars like Müller and Schwarz (2020) have found a direct correlation between the expansion of hate speech and the increase in hate crimes within a given territory. So, detecting hate speech and being able to predict its implications opens new lines of research on its potential effects on citizens. As stated in the Global Compact for Migration (UN, 2018), a better understanding of migration dynamics and the causes thereof is helpful for implementing measures seeking safe, orderly and regular migration. When studying the aspects affecting the flow of people within the European Union, predicting the social acceptance of migrants and refugees in various contexts is quite a challenge. Therefore, we must rely on all the available sources. There have already been some efforts in this direction, e.g., Arcila-Calderón et al. (2022b). This study relies on the Eurobarometer public opinion survey and uses computational methods to estimate the probability of acceptance of migrants and refugees in Europe.
This innovative approach is justified in international projects such as HumMingBird, 1 aimed at predicting the social integration of migrants and refugees in every European city. One of the limitations encountered is the scarce regional-level information provided by European polls and surveys on the social support towards these groups. Consequently, here we present the first large-scale study with a European Union scope. The study detects, simultaneously and longitudinally (including a 6-year period), (i) hate speech on Twitter; and (ii) how it affects citizens’ perception and acceptance of immigrants and refugees.
Hate speech has a major impact on the social environment and public discourse, particularly due to the tension and strain it creates, and also because it has a significant presence in user-generated media. It is difficult to factor this in when studying the probability of acceptance of migrants and refugees. However, incorporating this factor allows for an innovative approach and can offer a new perspective within these lines of work. Furthermore, since social media are currently the main channels for hate speech spread, it is worth assessing their potential to provide meaningful data on top of existing official indicators. Social media reflect public opinion in certain contexts. Twitter, in particular, with over 500 million posts per day, has a strong impact on a large share of the population (Sayce, 2020). During the so-called refugee crisis in 2015, almost 7.5 million tweets were collected through hashtags such as #refugee or #refugeecrisis (Siapera et al, 2018), and the widespread negative sentiment towards foreigners increased, as well as the hostility leading to the exclusion of migrants from jobs and welfare benefits (Inter-Parliamentary Union, 2015). This also allowed to assess the strategies of anti-immigration actors and xenophobic groups on social media (Ekman, 2019). In the context of this heated social debate, European decision-makers and political leaders try to achieve “fair migration,” benefitting all parties and fulfilling the human rights at stake whilst creating friendly environments and encouraging social cohesion in line with European diversity standards. On this basis, the goals laid down in the 2030 Agenda for Sustainable Development (UN, 2015) include working together to foster the social inclusion of migrants (Canelón & Almansa, 2018).
The origin of xenophobic and hate opinions, attitudes and behaviors can be explained, at least partly, relying on Intergroup Contact Theory (ICT) posed by Allport in The Nature of Prejudice, since it remains “a widely used framework in the study of intergroup relations and intergroup prejudice” (Broad et al., 2014: 49). Given the strong social presence of online media, we address a second dimension of ICT, taking the perspective of Mediated Intergroup Contact, particularly through user-generated media like social networking sites. This research thus relies on ICT and the theory of Mediated Intergroup Contact in order to (i) assess individuals’ relationships with migrants; and (ii) analyze such contacts through social media including hate speech as a determinant. ICT’s basic premise is that increased intergroup contact leads to more positive attitudes towards outgroup members (Abrams & Hogg, 2017), there being a relationship between the effects of contact and reduced levels of prejudice. Accordingly, contact between non-migrants and migrants encourages acceptance and a positive attitude towards the latter. ICT or contact hypothesis requires four essential factors to be effective, i.e., to reduce prejudice: equal status between the groups, intergroup cooperation, common goals, and the support of social and institutional authorities. First, equal status entails that there be no unequal hierarchical relationship, e.g., employed-unemployed, since there are negative effects from contact with outgroup members of lower status (Pettigrew, 1998). Second, intergroup cooperation entails that outgroup members work or operate within a non-competitive environment, which is directly related to the third factor, i.e., common goals, since the attainment of common goals must be an interdependent effort without intergroup competition. Finally, no institutional or social authority should prevent or otherwise undermine intergroup contact.
Linking the above conditions with the issue addressed herein, i.e., the acceptance of migrants and refugees, we should first inquire about whether, in places with a significant percentage of the immigrant population, (i) citizens will be more likely to have direct intergroup contact with migrants or refugees; and if, as a result, (ii) they will develop a more positive acceptance than other individuals not engaging in this contact (Abrams et al, 2018). Based on this, we state the first hypothesis to be tested:
-
H1: The share of immigrant population in European regions is positively correlated with citizens’ support towards that group, so that the higher the percentage of immigrants, the greater the support towards them.
Focusing on mediated intergroup contact, the boom of social media has raised significant new research questions, challenges, and opportunities regarding online social behavior and its impact on real life. Considering that interpersonal contact via social media is both unlimited and cheap. Online intergroup contact, whether positive or negative, can lead to attitudes, beliefs or thoughts that are expressed outside of social networks. Hate speech emerges as a determinant of mediated intergroup contact, so that if there is negative contact through social media triggered by hate speech, the offline attitude and acceptance will also be negative. Previous studies tried to explain if online engagement between persons with different backgrounds, experiences or opinions represents real life, offline intergroup relationships (Gallacher et al, 2021). The findings indicate that antagonistic or opposing groups took their online behavior to their real-world encounters. On top of that, their real-life behavior derived from negative intergroup contact, which increases concerns about polarization, because we could expect individuals to identify themselves as members of a social tribe thus expressing hostile attitudes towards outgroup members (Zhang et al, 2019). These concerns have given rise to the so-called “echo chamber effect” on social media, aimed at explaining how social media users seek or avoid information based on their ideological background whilst seeking like-minded users framing and reinforcing a shared narrative and thus affecting their offline behavior (Cinelli et al, 2021). Platforms like Twitter, with more than 400 million active accounts (We Are Social/Hootsuite, 2021), may have radicalized citizens’ beliefs, thereby making them reject or dismiss outgroup members outside their cultural, social, and economic circle. Therefore, we can assume that “it is increasingly important to understand intergroup contact as a straightforward yet potentially powerful strategy to reduce prejudice between groups” (Zhang et al, 2019). See next a few examples of messages containing hate speech on Twitter (translated from Spanish): “While they hinder Spaniards’ mobility, more than 700 illegal immigrants have assaulted our borders in the last few days. The Government's call effect continues and the resulting migratory avalanche that dooms the future of our neighborhoods. STOP THE INVASION!” (Vox, 2021). “Here is the beautiful Christmas present from those who hate us. The perpetrator of this disgusting massacre, a Palestinian 'holder of a REFUGEE travel document issued by Belgium!' For certain offenders, no red zones, no travel bans....” (Salvini, 2020).
Accordingly, if applied to the current times where new technologies reinforce communication on social media, “any strategy that seeks to understand and fight hate speech must include a communication approach” (Arcila-Calderón et al, 2021). Consequently, even if there is a significant share of migrants and refugees in a given region with positive direct contact, we can analyze the existing relationship with the hate level online in that territory. We thus state a second hypothesis:
-
H2: The share of immigrant population in European regions is correlated with the level of hate on Twitter, so that the greater the percentage of immigrants, the lesser the hate.
The foregoing suggests that it is necessary to inquire about the relationship between social media and their role representing social reality. The research conducted by Bollen et al (2011) found a statistically significant correlation between the mood states of tweets (tension, depression, anger, vigor, fatigue, confusion) and daily events gathered from media and other sources, attributing it a predictive value. To address this, we must use the available macrodata, providing information that can supplement other existing sources like the Eurobarometer (Eurobarometer, n.d.), the European Social Survey (ESS-ERIC Consortium, 2021), Gallup's Migrant Acceptance Index (Esipova et al, 2020), and other national sources, adding value to the predictions on the acceptance of migrants and refugees in their host territories. These sources and indicators have certain limitations, e.g., the social desirability bias, leading respondents to underreport socially undesirable attitudes and behaviors and to give more likeable answers that others want to hear, making it difficult to detect openly hateful content, like xenophobic or racist statements (Arcila-Calderón et al, 2020). Another meaningful limitation is that there is little information on the location of opinions because they are presented at a national or regional level. At this point, Twitter data can provide geolocation information, which would allow to cross-reference and contrast variables. On this basis, we expect Twitter to help model a depiction or representation of society relying on the posted messages, analyzing hate speech as a predictor of social acceptance of migrants and refugees in Europe and adding value to the existing indicators. Therefore, we state a final hypothesis:
-
H3: The level of hate speech on Twitter towards migrants and refugees in European regions is correlated with the degree of citizens’ support for these groups, so that the lesser the level of hate speech, the greater the acceptance of migrants and refugees.
Materials and methods
Sample and process
For this research we have used primary sources (databases with tweets and their hate level from all Europe between 2015 and 2020) and secondary sources (information provided by other studies and existing databases). A tweet database was generated: collected tweets using Twitter’s Application Programming Interface (API) (v2 full-archive search endpoint, using Academic research product track), which provides access to the historical archive of messages since Twitter was created in 2006 (the downloaded data from each tweet con be consulted in https://doi.org/10.6084/m9.figshare.16708942.v3). To download the tweets, we first defined the search filter by keyword and geographic zones using the Python programming language and the NLTK, Tensorflow, Keras and Numpy libraries. We established generic words directly related with the topic, taking into account linguistic agreement in Spanish (i.e., gender and number inflections) but without considering adjectives, for instance: migrant, migrants, immigrant, immigrants, refugee (both in masculine and feminine forms in Spanish), refugees (both in masculine and feminine forms in Spanish), asylum seeker, asylum seekers (the keywords are available as supplementary materials at: https://doi.org/10.6084/m9.figshare.16708945.v3). Then, we selected only those messages that had geolocation coordinates (coordinates tag in the Twitter object), so that each tweet provided the exact location using a longitude and latitude matrix, and only those messages that were not retweets or answers. Next, for categorizing the downloaded tweets into the 27 EU Member States (adding Switzerland, the United Kingdom and Norway in aggregated form), we used the Nomenclature of Territorial Units for Statistics (NUTS), which follows a hierarchical system for dividing up the economic territory of the EU and the UK into the major socio-economic regions (NUTS 1), basic regions for the application of regional policies (NUTS 2) and small regions for specific diagnoses (NUTS 3), relying on the Nominatim geocoder 2 and its association with the codes through Nuts Finder. 3 We focus on the NUTS 2 level, including regions that are able to implement migration-related policies. This work was supported by the infrastructure of the Supercomputing Center of Castille and Leon (Scayle).
Finally, for the process of hate speech detection in tweets, we used as a basis a tool (http://pharm-interface.usal.es) created and validated by Vrysis et al. (2021). For this research, the tool has been retrained with (i) supervised dictionary-based term detection; and (ii) also taking an unsupervised approach (machine learning with neural networks) using a corpus of 90,977 short messages, from which 15,761 were in Greek (5,848 with hate toward immigrants), 46,012 were in Spanish (11,117 with hate toward immigrants) and 29,204 in Italian (5,848 with hate toward immigrants). This corpus comes from two sources: one, the import of already classified messages in other databases (n=57,328, of which 5,362 are generic messages in Greek, 23,787 are generic messages and 9,727 are messages with hate toward immigrants in Spanish, and 18,452 are generic messages in Italian), and the other from messages manually coded by local trained analysts (in Spain, Greece and Italy), using at least 2 coders with total agreement between them (the level of agreement in the tests was 94%), dismissing those without a 100% intercoder agreement (n=33,649, of which 6,040 are messages about immigration without hate and 4,359 are messages with hate toward immigrants in Greek; 11,108 are messages about immigration without hate and 1,390 are messages with hate toward immigrants in Spanish; and 4,904 are messages about immigration without hate and 5,848 are messages with hate toward immigrants in Italian). The corpus was divided into 80% training and 20% test. In the models, embeddings were used for the representation of language and Recurrent Neural Networks (RNN) for the supervised text classification. Specifically, the embeddings were created with the 1,000 most repeated words with 8 dimensions (first input layer), two hidden layers’ type Gated Recurrent Unit (GRU) with 64 neurons each, and a dense output layer with one neuron and softmax activation (the model is compiled with Adam optimizing and the Sparse Categorical Crossentropy loss).
The evaluation of the detection model offered good results: in Greek, hate (accuracy=0.78, precision=0.79, recall=0.75, F-score=0.77), no hate (accuracy=0.78, precision=0.76, recall=0.80, F-score=0.78); in Spanish, hate (accuracy=0.87, precision=0.87, recall=0.86, F-score=0.87), no hate (accuracy=0.87, precision=0.86, recall=0.87, F-score=0.87); and in Italian, hate (accuracy=0.90, precision=0.93, recall=0.87, F-score=0.90), no hate (accuracy=0.90, precision=0.88, recall=0.94, F-score=0.91). Additionally, we developed an external validation phase –with 10,285 new tweets collected in a later period, between November and December 2020, classified by the model and by one of the human trained coders–. This validation offered acceptable quality evaluation metrics for the hate category: accuracy=0.85, AUC-ROC=0.88, F-score=0.74, Loss=0.46. The specific results of the tests of previous models with different algorithms, parameters and training corpus, as well as the validation processes, are completely reported in Arcila-Calderón et al. (2022a).
For this study, we have managed to download and store a database with a total sample of 847,978 Twitter messages from the last six years (193,676 in 2015, 182,634 in 2016, 121,465 in 2017, 140,293 in 2018, 112,552 in 2019 and 97,358 in 2020) from 30 European countries with messages referring to migrants or refugees and including geolocalization data (in the supplementary materials, the number of tweets per year and country can be found: https://doi.org/10.6084/m9.figshare.17186108.v2). These messages have been run over the detector to obtain the results that will be explained next.
To make up for the language diversity across the European Union, the Google Translate 4 and Python texblob 5 APIs provide a translation, even if the language has not been declared. Relying on these APIs, all messages have been automatically translated into Spanish, as it was the language in which the external validation was conducted. Furthermore, in order to correlate and contrast these Twitter data with existing data and study migrant and refugee acceptance scenarios, we relied on various secondary sources. First, the so-called Census Hub, within the European Statistical System (ESS), which provides detailed data on the size, characteristics of the population and housing in Europe. These data are updated every 10 years, so the relevant census for this research is the 2011 census (European Commission, 2016).
Second, we use the results of the study carried out by Arcila-Calderón et al. (2022b), which estimates the probability of acceptance of refugees in Europe at a regional level (NUTS 2) based on Eurobarometer (2015-2017) data and applying computational methods that combine machine learning and synthetic populations. The study creates “acceptance probabilities” toward migrants for each NUTS 2, extrapolating demographic data in each region and comparing them with the models produced by national surveys (using the algorithms: logistic regression, decision trees, random forest, vector machines support k-nearest neighbour), so that it created artifitial or synthetic populations with 10,000 inhabitants in each of the 271 European regions to estimate the probability of each individual and then the average of all the individuals of the region.
Measures and analysis
Three variables were used in this study:
-
The level of hate speech online towards immigrants and refugees on Twitter: the average hate level of posted tweets broken down by European regions, measured using the hate detector, which is based on the one developed by Vrysis et al. (2021), retrained for this study. The values range between 0 and 1, 0 being the absence of hate speech and 1 being the presence of hateful content. These data were obtained by applying the detector to the Twitter archive created for this research and filtered by content, date and geolocation.
-
Level of support towards migrants and refugees: this indicator is based on average public opinion regarding the support for measures aimed at integrating refugees. The indicator was created using the Eurobarometer survey at various stages (second semester of 2015, first semester of 2016, second semester of 2016, first semester of 2017 and second semester of 2017). The values are continuous and range between 0 (less support) and 1 (greater support). These data were obtained from the simulations conducted in the study by Arcila-Calderón et al. (2022b) based on the Eurobarometer public opinion survey (2020).
-
Share of foreign population: this measure was obtained from the number of foreign persons in each European region (NUTS 2) overall. The values range between 0 and 1, 0 being the absence of foreign population and 1 meaning that the foreign population is 100% overall. These figures were obtained from the Census Hub database.
Visual, 6 descriptive and correlational analyses are used for analyzing the data and indicators and testing the hypotheses. Regarding the visual analyses, we prepared comparative maps for every year using the Tableau software, designed for data processing, analysis and visualization. We used other previously created maps showing the level of support towards the analyzed groups (Arcila-Calderón et al., 2022b) and the share of immigrants and native inhabitants per region. The maps represent descriptive data for every measure (averages) using Excel and SPSS as statistical software. SPSS is also used to test statistical correlations in order to analyze if there are statistically significant relationships between variables.
Analysis and results
The results of using the hate detector to analyze the database comprising 847,978 messages per year in EU countries are presented in Table 1.
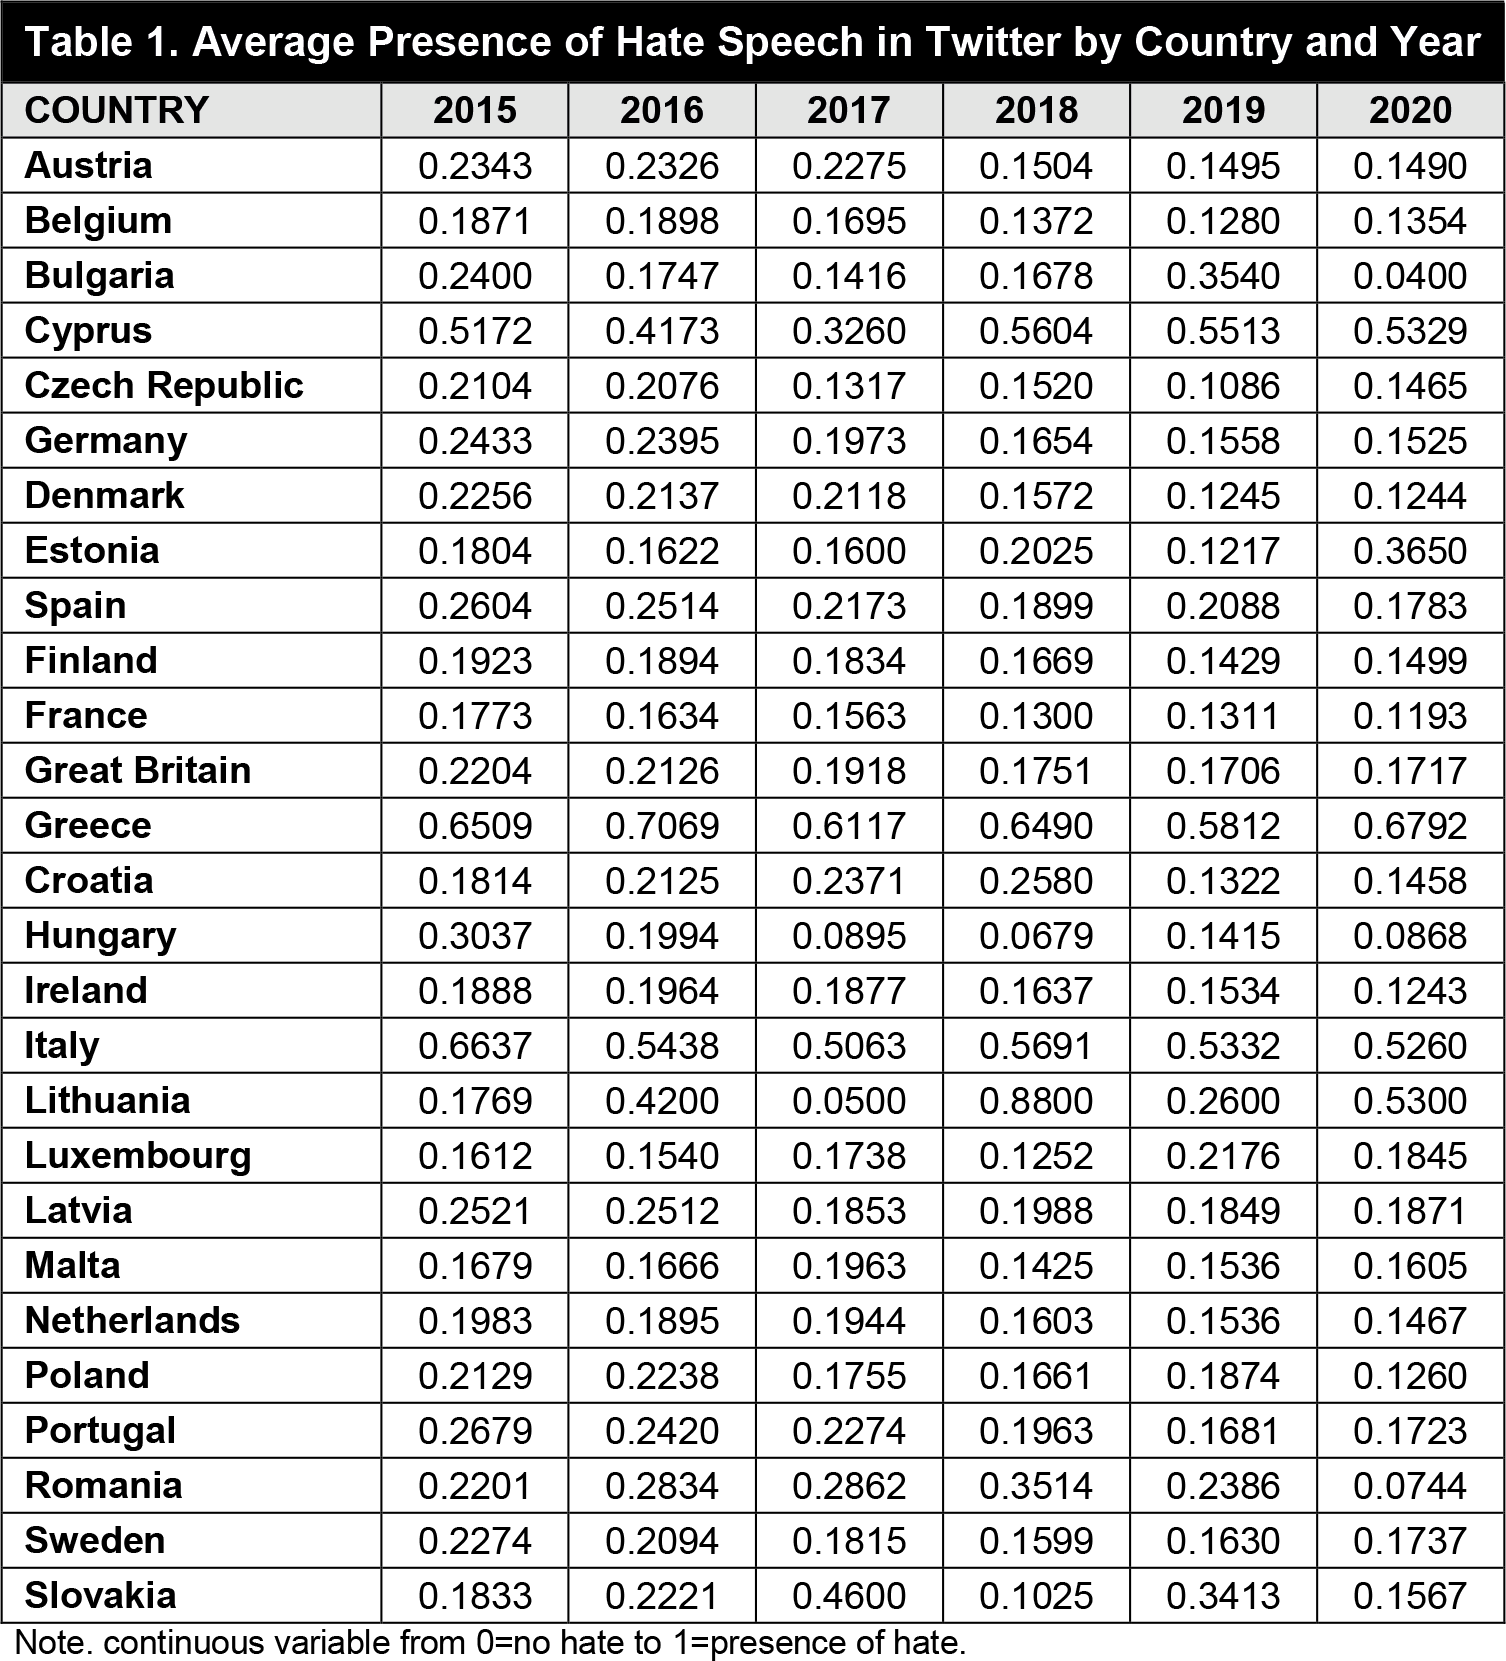
We found that some countries are noteworthy for their peaks, e.g., Cyprus, Greece, Italy or Lithuania. Our findings show some major variations depending on the year.
Sometimes it is a decrease in hateful content (see Lithuania’s downward variation from 0.88 in 2018 to 0.53 in 2020) and in other cases there is an increase in hate speech (e.g., Cyprus went from a value of 0.32 in 2017 to a 0.53 score in 2020). The supplementary materials include the yearly average broken down by regions (NUTS 2: https://doi.org/10.6084/m9.figshare.16708969.v1) and cities (NUTS 3: https://doi.org/10.6084/m9.figshare.16708954.v1).
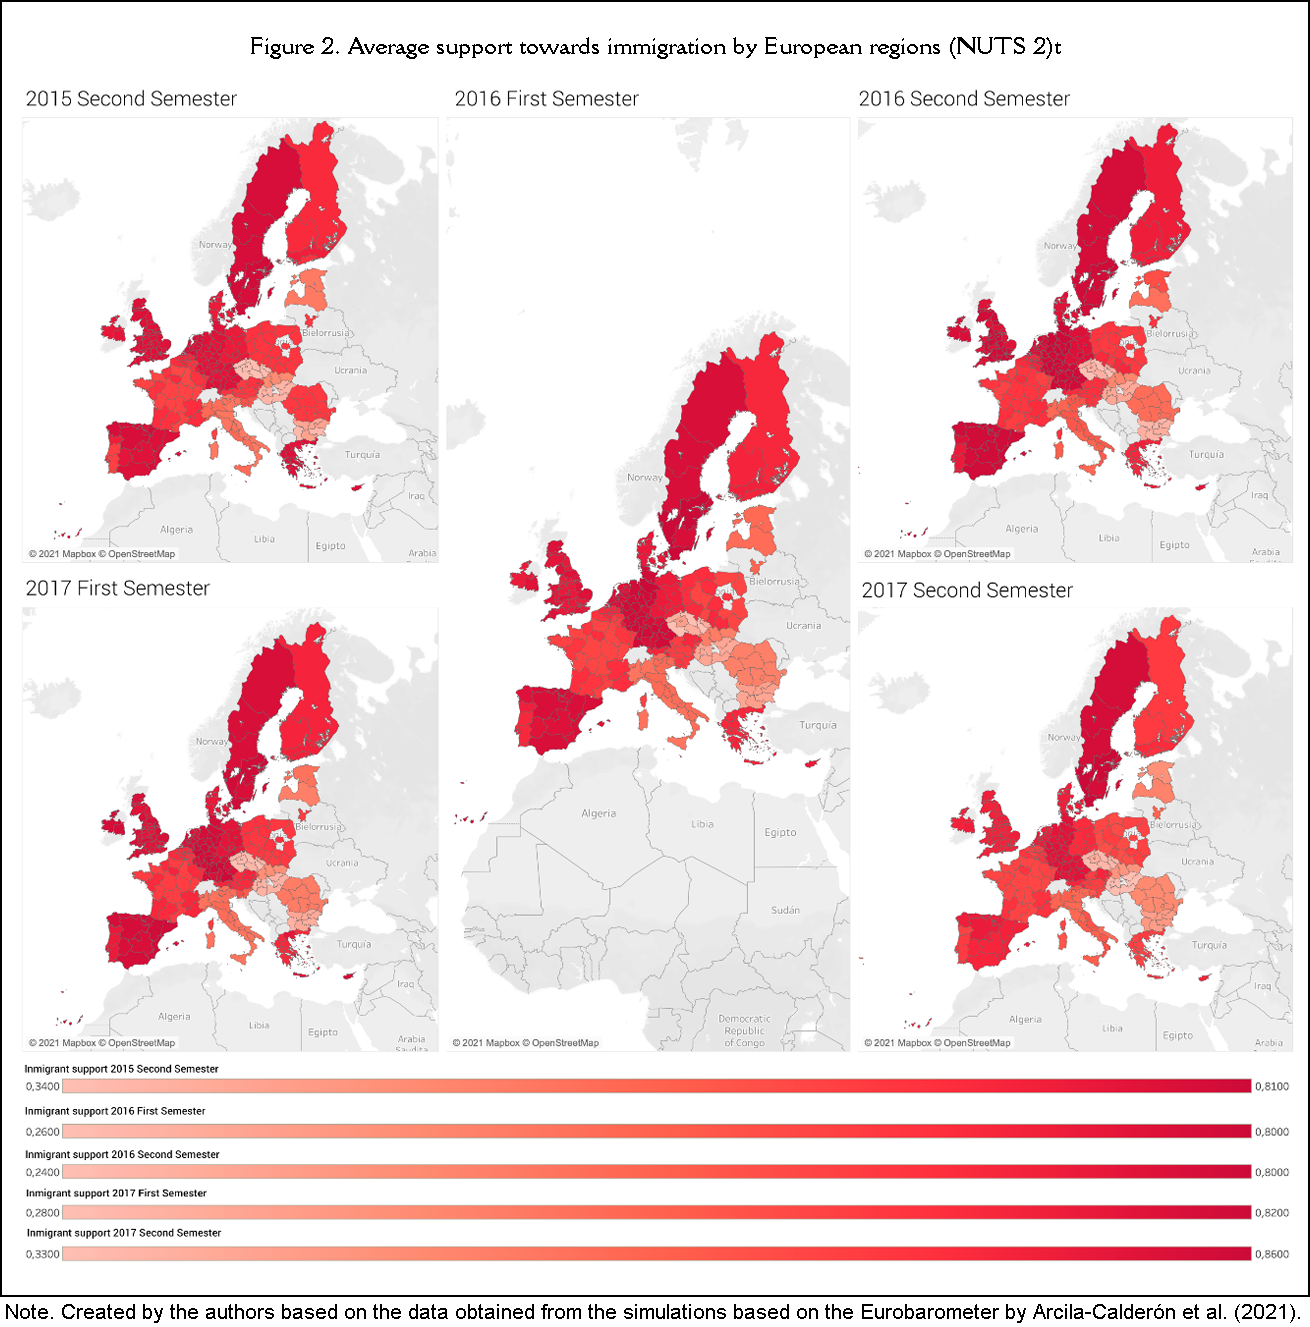
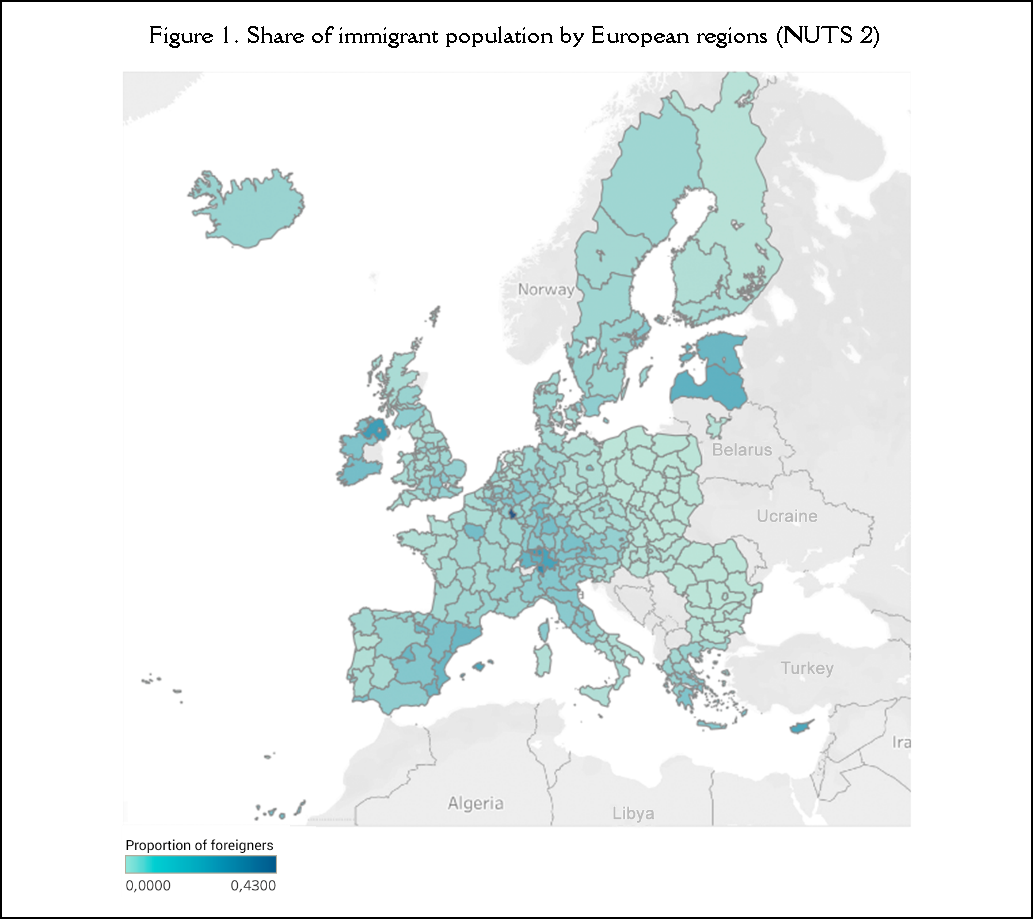
Considering the first hypothesis (H1), posing that the share of immigrant population in European regions (NUTS 2) is related to citizen support towards immigrants, is depicted in a map (Figure 1) visually presenting the percentage of immigrants by region. As can be noticed, Southern or Mediterranean Europe has a higher percentage of immigrants than other mainland areas. Furthermore, a visual map is also used to show the average support towards immigrants and refugees during each period selected, with data obtained from the Eurobarometer (Figure 2). The mapped average support is mostly positive except in certain regions that drag the average down, like Italy and Eastern Europe.
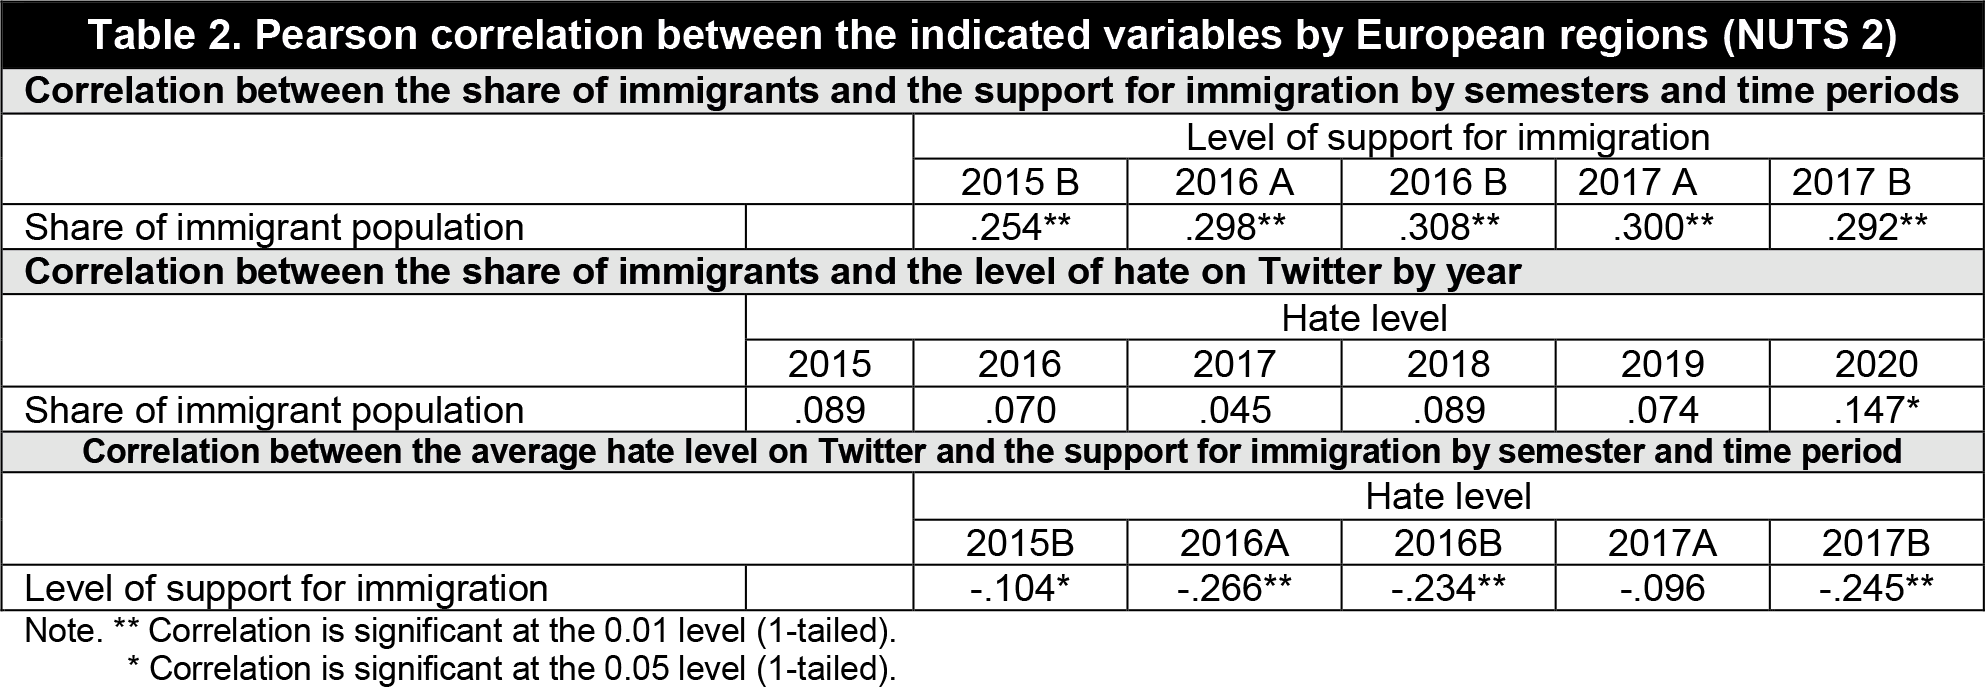
The correlation test shows a statistically significant correlation between the variable “share of immigrant population by European regions” (NUTS 2) and the variable “support towards immigrants” in the second semester of 2015 (r=.254, p<.001), in 2016, first semester (r=.298, p<.001) and second semester (r=.308, p<.001), as well as in 2017, both in the first (r=.300, p<.001) and second semesters (r=.292, p<.001) (Table 2). Relying on the work of Sampieri et al. (2014), it is worth noting that the correlation is positive but weak, since it ranges between .10 and .50. Note that it is a positive relationship, thus confirming the hypothesis (H1) that the higher the percentage of immigrants in a given region, the greater the support towards them.
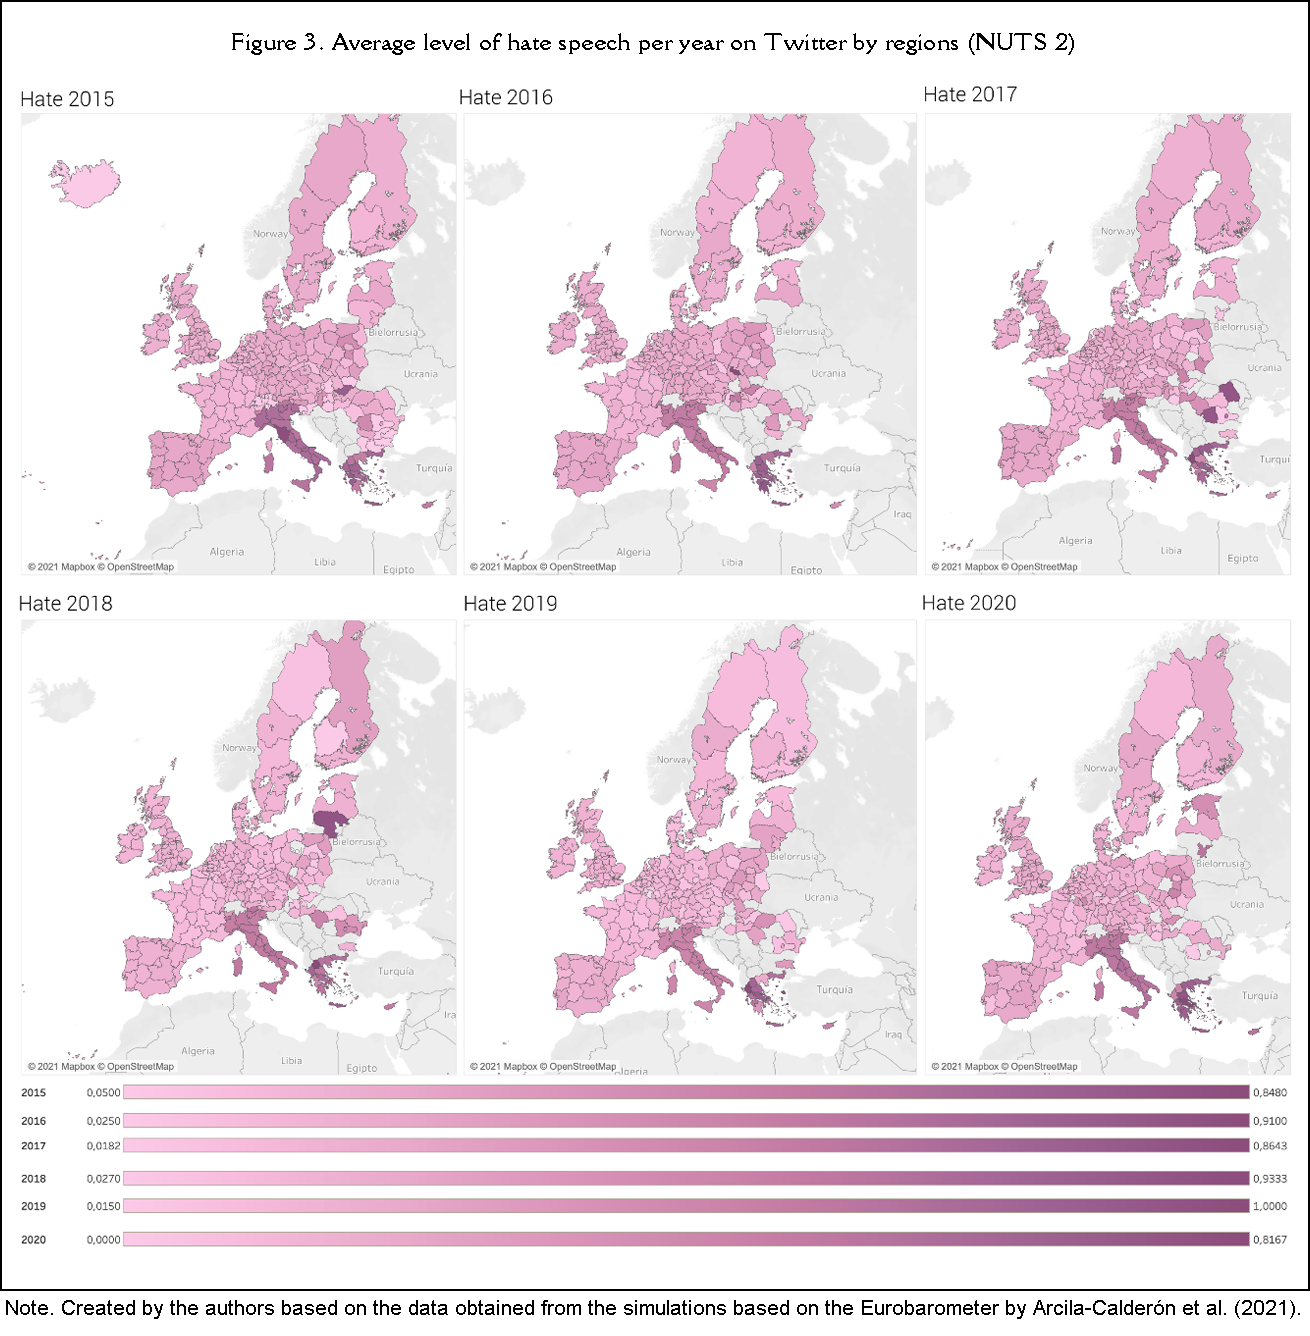
To test the second hypothesis (H2), which suggested that the share of immigrant population in European regions (NUTS 2) is correlated with the hate level on Twitter, first see the maps depicting the average values for both variables (Figure 1 and Figure 3) broken down by regions and years. As for the hate level, Figure 3 shows that in the darker areas there is more hate, and in 2020 we found remarkably high levels of hate in Italy and Greece.
Table 2 below includes the correlation analysis between the share of immigrant population and the average level of hate speech found on Twitter, broken down by the studied years and European regions (NUTS 2). We found that the correlation between the share of immigrants by European region is statistically trending in 2015 (r=.089, p<.10) and 2018 (r=.089, p<.10), and not significant in 2016 (r=.070, p>.10), 2017 (r=.045, p>.10) and 2019 (r=.074, p>.10). However, there is a statistically significant correlation in 2020 (r=.147, p<.05). There is a positive trend, thus disproving our hypothesis (H2), i.e., that the greater the percentage of immigrants in a region, the lesser the level of hate speech on Twitter towards migrants and refugees, since the only significant result and the two trends show the opposite relationship.
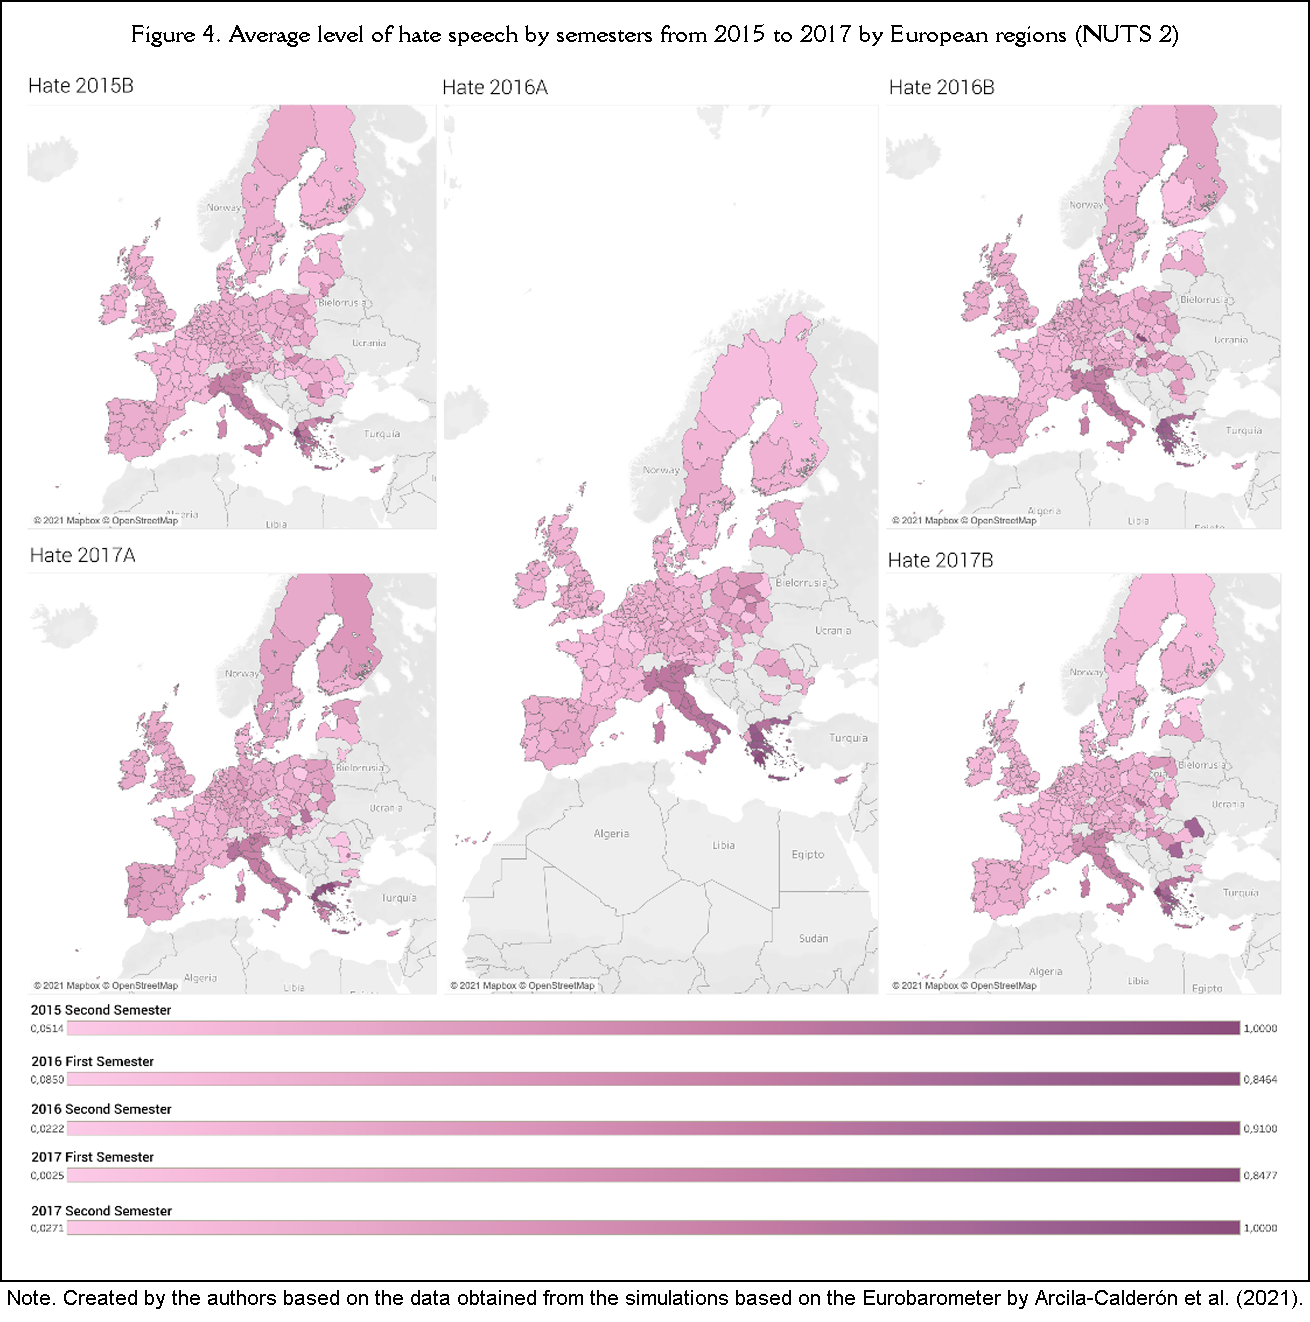
To test hypothesis H3, posing that the level of hate speech on Twitter towards migrants and refugees in European regions (NUTS 2) is correlated with the degree of citizen support for these groups, Figure 2 provides the visual map depicting the latter variable. Also, a new map is added, showing the average level of hate speech over the same time periods (Figure 4), which is very similar to the yearly values of Figure 3, with greater hate speech in countries like Italy or Greece.
In Table 2, the correlation between the support towards immigration (by semester) and the level of hateful content on Twitter during those time periods shows that the second semester of 2015 (r=-.104, p<.05), the first semester of 2016 (r=-.266, p<.001), the second semester of 2016 (r=-.234, p<.001), and the second semester of 2017 (r=-.245, p<.001) were statistically significant with a negative trend. Therefore, the hypothesis that regions with a lower level of hate speech on Twitter are more supportive of immigrants was validated. The only non-significant period was the first semester of 2017 (r=-.096, p>.05).
Conclusions and discussion
This research has required demanding documentation efforts, collecting large datasets, classifying, and applying advanced computational methods to supplement the common framework of studies on migration flows and dynamics in Europe. Relying both on data generated at large scale and existing indicators, this research was aimed at studying future scenarios of acceptance towards immigrants and refugees, considering the intergroup contact theory (ICT) to attempt an explanation of the hostility towards these social groups, and using hate speech, for the first time, as a predictor of such acceptance. A valuable contribution of this study includes proving the ability to obtain geolocated data from social media allowing for new cross references from innovative perspectives, also overcoming some of the limitations of the existing official indicators based on surveys, e.g., high costs, time, the amount of data or the lack of detail for specific locations.
First, this research tests the long-standing principles of Allport’s (1954) ICT, analyzing if regions with higher immigration rates foster positive interpersonal contact, assuming (based on the ICT) that intergroup contact can encourage tolerance and acceptance. This claim, raised in hypothesis H1, is validated by our findings and results. Therefore, it is worth stating that there is greater support for immigrants in European regions with a higher share of immigrants. Along these lines —although assuming the perspective of the mediated ICT and considering hate speech as a factor mediating between the effects of contact with outgroup members and individuals’ attitudes— this research analyzed if regions with higher immigration rates show a lower level of hate speech on Twitter, as stated in hypothesis H2. In this case, only a significant result was obtained, but the opposite premise was proven, i.e., that the higher the share of immigrants, the greater the level of hate speech on Twitter. As noted above, this can be due to the social desirability shown by respondents, who give answers that differ from their actual attitudes, values or behaviors, to look better to others or to provide a socially preferred image (Larson, 2019). So, social media and virtual communities can provide users with anonymity for them to express their real ideas and opinions, thereby changing their behavior online from their real-world behavior (Joinson, 1999).
Finally, this research has reviewed the relationship between the level of hate speech towards migrants and refugees on Twitter and the level of support for immigration obtained from the Eurobarometer and stated in hypothesis H3. The result is significant, thus confirming H3 since regions with greater support recorded a lower level of hate speech on Twitter. This is an innovative knowledge scenario for the acceptance of migrants and refugees in European regions relying on the presence of geolocated hate speech. For the first time, we can conduct new studies based on existing indices and indicators or previous results yet enhanced by geolocation and the pulse of anonymized social engagement and conversation in user-generated media. Therefore, this work has accomplished its objective of discovering social acceptance of migrants and refugees in European regions, through a large-scale longitudinal analysis of online hate speech on Twitter and its contrast with existing official indicators. These findings are a great leap for studying the origins of hate speech narrowing it down to specific territories, and they can help to come up with solutions and measures to tackle the expansion of discriminatory, racist, and xenophobic behaviors. Social media pose a true challenge for social scientists seeking to analyze online messages with a purpose of better understanding human interaction and improving the human condition (Felt, 2016). Future lines of work can also deepen into the influence of other mass media in the acceptance of migrants and refugees to compare with these indicators.
As for the limitations of this research work, first we need to take into account that Twitter is not considered representative of the whole society and its reality, but it can offer very relevant guidelines given the free expression of opinions among its diversity of users. Furthermore, handling and processing geolocation macrodata has been complex, and this complexity has led to reducing the sample size for the sake of data quality. At the same time, updating the data is essential to accurately determine the results, since the census used is updated every 10 years. As for the time scope, the different periods considered for each measure should be acknowledged as a limitation. For future works, it would be advisable to increase uniformity, e.g., for the immigrant support indicators in the Eurobarometer surveys (2020). Other limitation to consider is automatic translation (instead of the creation of ex prefeso models for each language), given that in a new external validation with 500 translated tweets (including messages in Spanish, Greek or Italian) randomly selected from the sample and compared with the predictions of the model, we found that, although in general terms classes can be detected with some accuracy (accuracy=0.72), the prediction of hate is very weak (precision=0.18, recall=0.28, F-score=0.22), compared to the prediction of non-hate (precision=0.80, recall=0.79, F-score=0.83) for these automaticly translated messages. Additionally, it should be mentioned that the results might be influenced by online bot campaigns or by offline events strongly affecting online conversations, such as the “Aquarius” case (Arcila-Calderón et al., 2021). The approach to hate speech is generic given that it is analyzed using thematic filters, but the different types of online hate are not studied in detail. Besides, the keywords are specific, and a more in-depth study could be conducted considering the linguistic idiosyncracy of each country and the fact that, in each European territory, there are normative frameworks and regulations of speech in social media that can also condition the existance of a larger or smaller degree of hate speech.
Generally, this work raises new questions and opens additional lines of research, allowing (i) to continue inquiring about the use of new technologies and online platforms on top of the existing traditional methodologies; and, after creating more complex models, (ii) to present possible tools and means to fight the detected social issues.
Authors’ Contribution
Conceptualization, C.A-C.; Review of literature (state-of-the-art), C.Q-M, D.B-H, J.J.A; Methodology, C.A-C, P.S-H; Data analysis, C.Q-M., C.A-C, P.S-H, D.B-H, J.J.A.; Results, C.Q-M., P.S-H, J.J.A, D.B-H; Discussion and conclusions, C.A-C, P.S-H; Writing (original draft preparation), C.A-C, P.S-H, C.Q-M.; Final review and editing, C.A-C, P.S-H, C.Q-M, J.J.A, D.B-H; Project design and sponsorship, C.A-C, P.S-H, J.J.A, D.B-H. (1)