Application and challenges of eye tracking technology in Higher Education
Abstract
Advances in neuro-technology provide new insights into how individual students learn in educational contexts. However, applying it poses challenges for teachers in natural settings. This paper presents an example of the use and applicability of eye-tracking technology in Higher Education. We worked with a sample of 20 students from three universities (Burgos and Valladolid in Spain and Miño in Portugal). The objectives were: (1) to determine whether there were significant differences in indicators of cognitive effort (FC, FD, SC, PD, VC) found with eye-tracking technology between students with and without prior knowledge; (2) to determine whether there were clusters of learning behavior patterns among students; and (3) to analyze differences in the visualization of behavior patterns. A quasi-experimental design without a control group and a descriptive design were used. The results indicated significant differences in learning outcomes between students with and without prior knowledge. In addition, two clusters were found in indicators of cognitive effort. Finally, a comparative analysis of learning behavior patterns between students in cluster 1 vs. cluster 2 was performed. Eye-tracking technology makes it possible to record large data about the learning process. However, using it in natural educational settings currently requires teachers to have technological and data mining skills.
Keywords
Neuro-education, learning patterns, eye tracking, personalized learning, cluster analysis, educational technology
Palabras clave
Neuroeducación, patrones de aprendizaje, seguimiento ocular, aprendizaje personalizado, análisis de clúster, tecnología educativa
Resumen
Los avances neurotecnológicos están posibilitando en los contextos educativos nuevos conocimientos sobre la forma de aprender de cada estudiante. No obstante, su aplicación plantea retos para la docencia en contextos naturales. En este trabajo se presenta un ejemplo de uso y aplicabilidad de la tecnología de seguimiento ocular en el ámbito de la Educación Superior. Se trabajó con una muestra de 20 estudiantes de tres universidades (Burgos y Valladolid en España y Miño en Portugal). Los objetivos fueron: 1) comprobar si existían diferencias significativas en indicadores de esfuerzo cognitivo (FC, FD, SC, PD, VC) hallados con la tecnología de seguimiento ocular entre estudiantes con y sin conocimientos previos; 2) comprobar si existían clústeres de patrones de conductas de aprendizaje entre los estudiantes; 3) analizar diferencias en la visualización de los patrones de conducta. Se utilizó un diseño cuasiexperimental sin grupo control y un diseño descriptivo. Los resultados indicaron diferencias significativas entre los estudiantes con y sin conocimientos previos respecto de los resultados de aprendizaje. También, se hallaron dos tipos de clústeres en los indicadores de esfuerzo cognitivo. Finalmente, se efectuó un análisis comparativo sobre los patrones de conducta de aprendizaje en estudiantes del clúster 1 vs. clúster 2. El uso de la tecnología de seguimiento ocular posibilita el registro de un gran volumen de datos respecto del proceso de aprendizaje. No obstante, su uso en contextos educativos naturales exige al profesorado conocimientos tecnológicos y de minería de datos.
Keywords
Neuro-education, learning patterns, eye tracking, personalized learning, cluster analysis, educational technology
Palabras clave
Neuroeducación, patrones de aprendizaje, seguimiento ocular, aprendizaje personalizado, análisis de clúster, tecnología educativa
Introduction and state of the art
This study examines the functionality of using eye-tracking technology in the teaching-learning context in a university setting. It is important to first address what eye-tracking technology is. It was first used in 1800 and one of the most notable figures in its development was Louis Émile Javal, who used eye tracking in optical physiology to study strabismus. Eye-tracking technology is based on recording the visual sweeps a person makes when they interact with objects, images, videos, documents, spaces, etc.
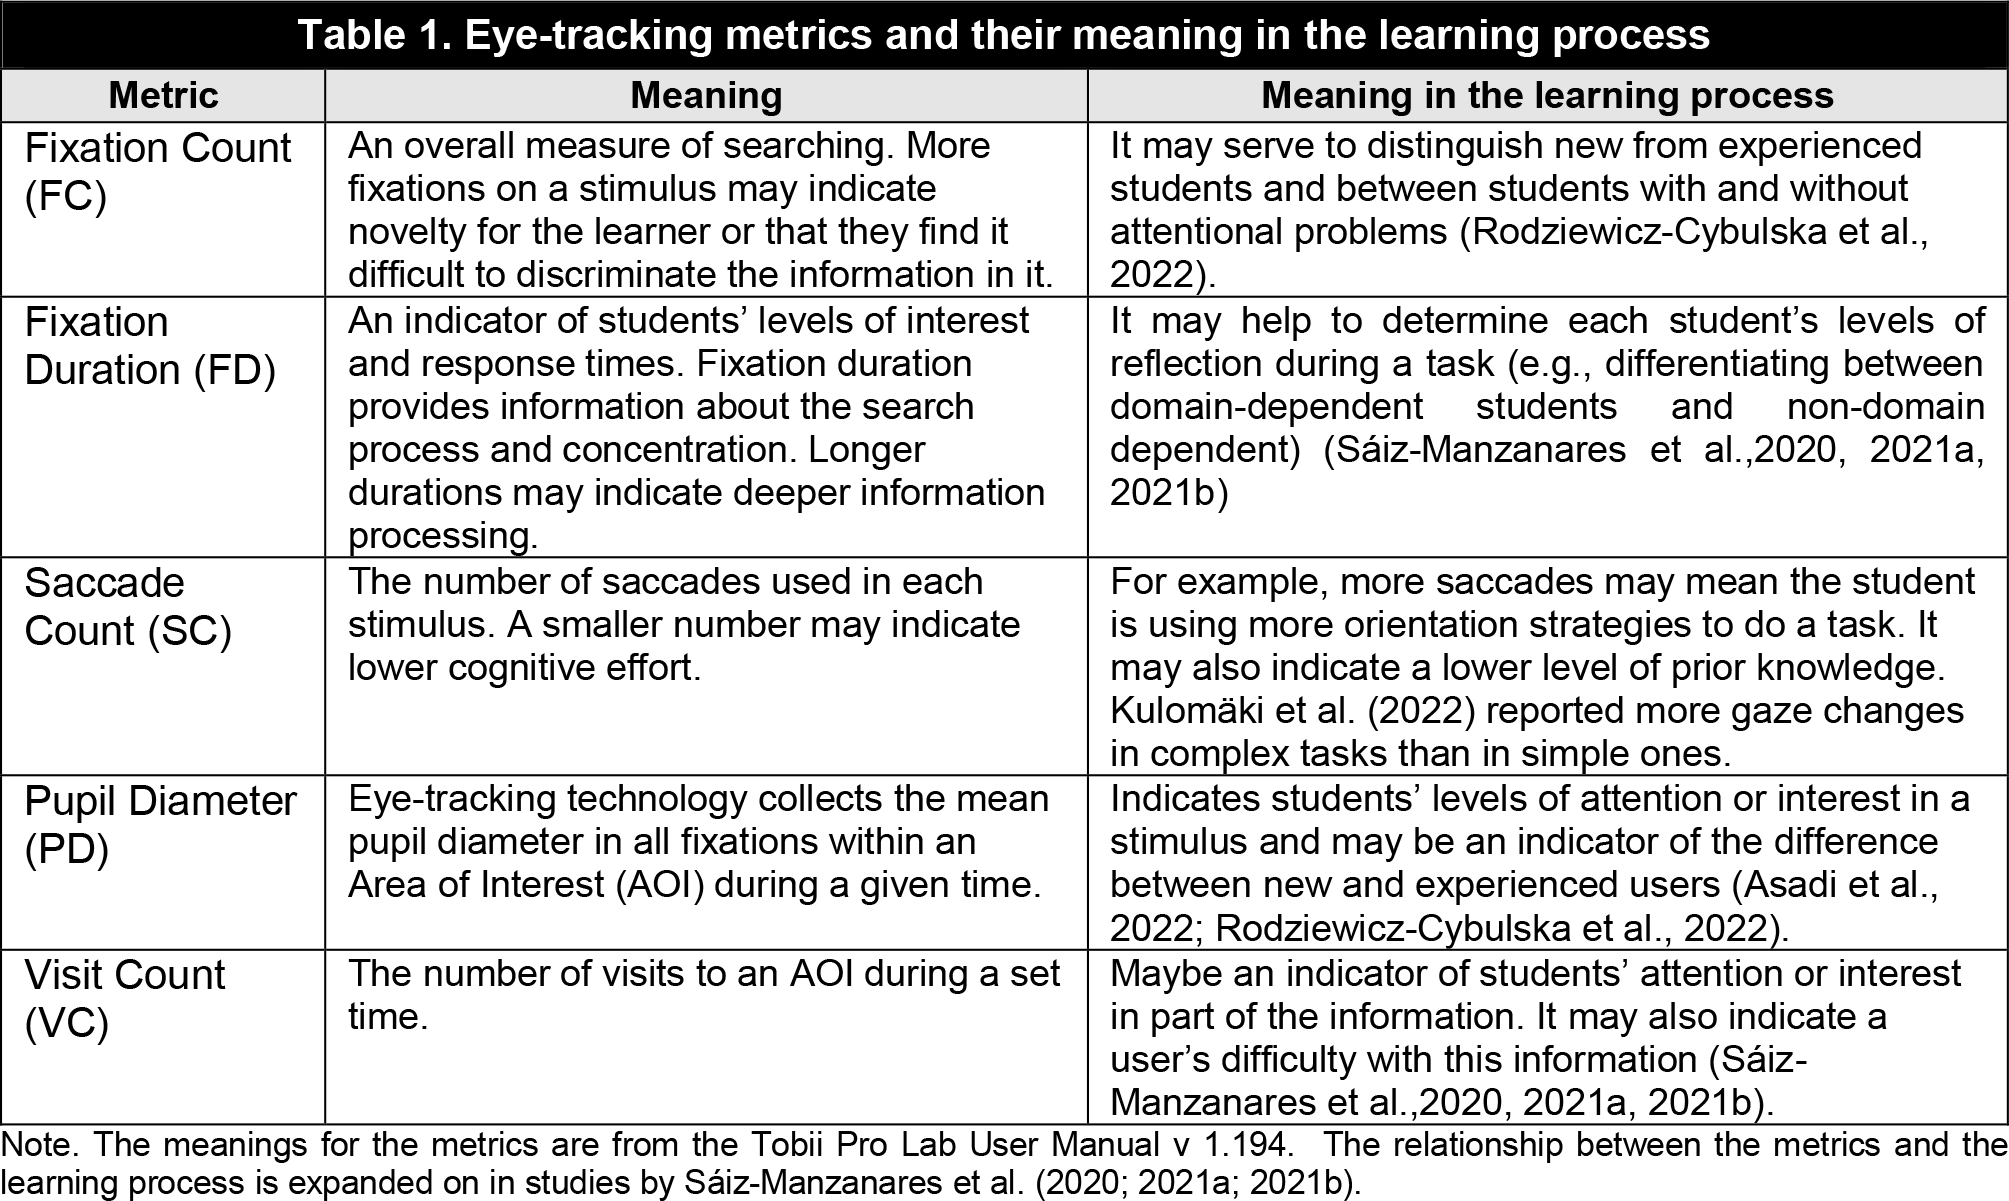
The metrics this technology collects can be classified as static or dynamic. Static metrics include fixations (these refer to the frequency of positioning the gaze on a stimulus) (Joe-Louis-Paul et al., 2019), saccades (these refer to the movement from one stimulus to another) (Elliott et al., 2020), pupil diameter (this refers to the dilation of the pupil for different stimuli) (Sáiz-Manzanares et al., 2021a), and chain length (referring to the length of the scan path or gaze point for each participant in the eye tracking route implemented) (Kao et al., 2019; Seifert et al., 2017). The dynamic metrics record the time of gaze fixation within an area defined by cartesian coordinates (Sáiz-Manzanares et al., 2020). That area can be split up by the experimenter into relevant areas, non-relevant areas, or partially relevant areas (Joe-Louis-Paul et al., 2019). In other words, eye-tracking technology records each person’s exploration path in a given time interval (Sáiz-Manzanares et al., 2021a). Table 1 gives information about some of the static metrics and their potential interpretation in the teaching-learning process. These interpretations are included in the user manuals for eye-tracking technology.
What does eye-tracking technology offer the teacher?
Eye-tracking technology is used as a tool supporting the study of human behavior and can be applied in various fields, including education (Tsai et al., 2022). More specifically, it can be used in the education field to study attention levels and their relationship with learners’ cognitive processes (Taub & Azevedo, 2019) while doing a task (Ollesch et al., 2021). As noted above, the technology provides static and dynamic metrics. The static metrics cover a range of different parameters (duration, frequency, speed, and number of fixations and saccades, along with pupil diameter, etc.) (Merchie et al., 2022). The ultimate aim of analyzing these metrics is to detect patterns of behavior with the stimulus, and, based on the learning results, determine which is more effective (Chango et al., 2022). The specific benefits of these static metrics in education are related to the information they give to teachers about students’ levels of attention and cognitive effort when doing various types of tasks (Prokop et al., 2020; Shojaeizadeh et al., 2019; Yang & Wang, 2023). This data allows teachers to tailor the content or structure of learning tasks to the needs of each student, driving the personalization of learning (Chemerys & Ponomarenko, 2022; Ollesch et al., 2021).
Eye-tracking technology also records dynamic metrics about the path and time of a student’s gaze while they complete a task (Diwanji, 2022; van-Marlen et al., 2018). Within each stimulus (elements making up a learning task), teachers can differentiate relevant Areas of Interest (AOI) (the information the teacher considers to be most important) and non-relevant areas (those they think are less important). Once that differentiation of AOIs is made, teachers can find patterns of student behavior within the applied learning stimulus (Coskun & Cagiltay, 2022; Merchie et al., 2022; Tsai et al., 2022). The relationship between those patterns and learning outcomes can then be analyzed (McLeod et al., 2022; Ollesch et al., 2021) to identify the most effective (Feng & Law, 2021; McLeod et al., 2022; Merchie et al., 2022; Tsai et al., 2022; Yang & Wang, 2023). In summary, the data offered by eye-tracking allows teachers to provide specific pedagogical guidance aimed particularly at students with less satisfactory results (Molina et al., 2017; Sáiz-Manzanares et al., 2021b).
What are the problems and limitations of using eye-tracking technology in a natural learning context?
Eye-tracking technology has become much more user-friendly over the last ten years and modern eye-tracking equipment can be applied more easily in natural settings (Schweizer et al., 2022). The technology can also be incorporated into augmented reality devices (Thees et al., 2022), virtual reality devices (Chango et al., 2022; Mills et al., 2016; Rother & Spiliopoulou, 2022; Yang & Wang, 2023), or mobile devices (Kuhnel et al., 2018). All this functionality will make it easier to apply the technology in day-to-day teaching. However, using eye tracking presents significant challenges for teachers.
Firstly, although the devices have become smaller and can be used outside the laboratory, they still need skilled users to deal with them. The process in an educational setting would involve 1) designing the learning task; 2) integrating the task and the eye-tracking device; 3) calibrating the students’ gaze for the screen; 4) once the learning activity is completed, the recorded data must be extracted, refined, treated, and interpreted. Currently, eye-tracking technology offers a simple automatic interpretation of data. However, that does not include all of the data treatment and analysis possibilities. The challenge in this regard is the large volume of data that these devices collect (Sáiz-Manzanares et al., 2020). This is a very important functionality but requires the application of Educational Data Mining (EDM) techniques in order to properly analyze and interpret the results (Chango et al., 2022; Feng & Law, 2021). These techniques involve using Machine Learning algorithms to analyze educational data (Bogarín et al., 2018). In short, eye-tracking technology in educational contexts is promising, but to use it well requires teachers to be trained in the aspects indicated above.
What are the possibilities of using other neurological evaluation resources with eye-tracking technology?
Other recording devices can be included with eye-tracking technology, such as devices to measure galvanic skin response (GSR) (He et al., 2022), electroencephalography (EEG), (Luo & Zhou, 2020; Scharinger et al., 2020), and recording the learner’s face for subsequent analysis of emotions during a task. The technology, depending on the sophistication of the equipment, can also facilitate incorporating these metrics in multiple records. That would give greater confidence in the interpretations of students’ learning processes (Alemdag & Cagiltay, 2018), although they would need to be applied in laboratory settings. It is also important to bear in mind that they would provide information about students’ information processing during different types of tasks (Giannakos et al., 2019).
As already noted, task design is fundamental in this context. This is because, depending on each learner’s learning style, one presentation or another of the same task could be more—or less—effective for the learning process. Along these lines, studies using multi-channel analysis (Azevedo & Gašević, 2019; Taub et al., 2017) have concluded that tasks that are offered through dual channels (audio and video) increase the cognitive load in information processing (Souchet et al., 2022).
In addition, tasks that are presented through video and which require the application of procedural knowledge have a higher cognitive load for the student (Pi & Hong, 2016). In contrast, it seems that including graphics or diagrams in tasks reduces cognitive load and eases understanding (Fiorella, 2022). Nonetheless, interpreting these results requires the application of EDM techniques, the most notable of which are described below.
What does using EDM techniques offer for the interpretation of eye-tracking results from the teaching-learning process?
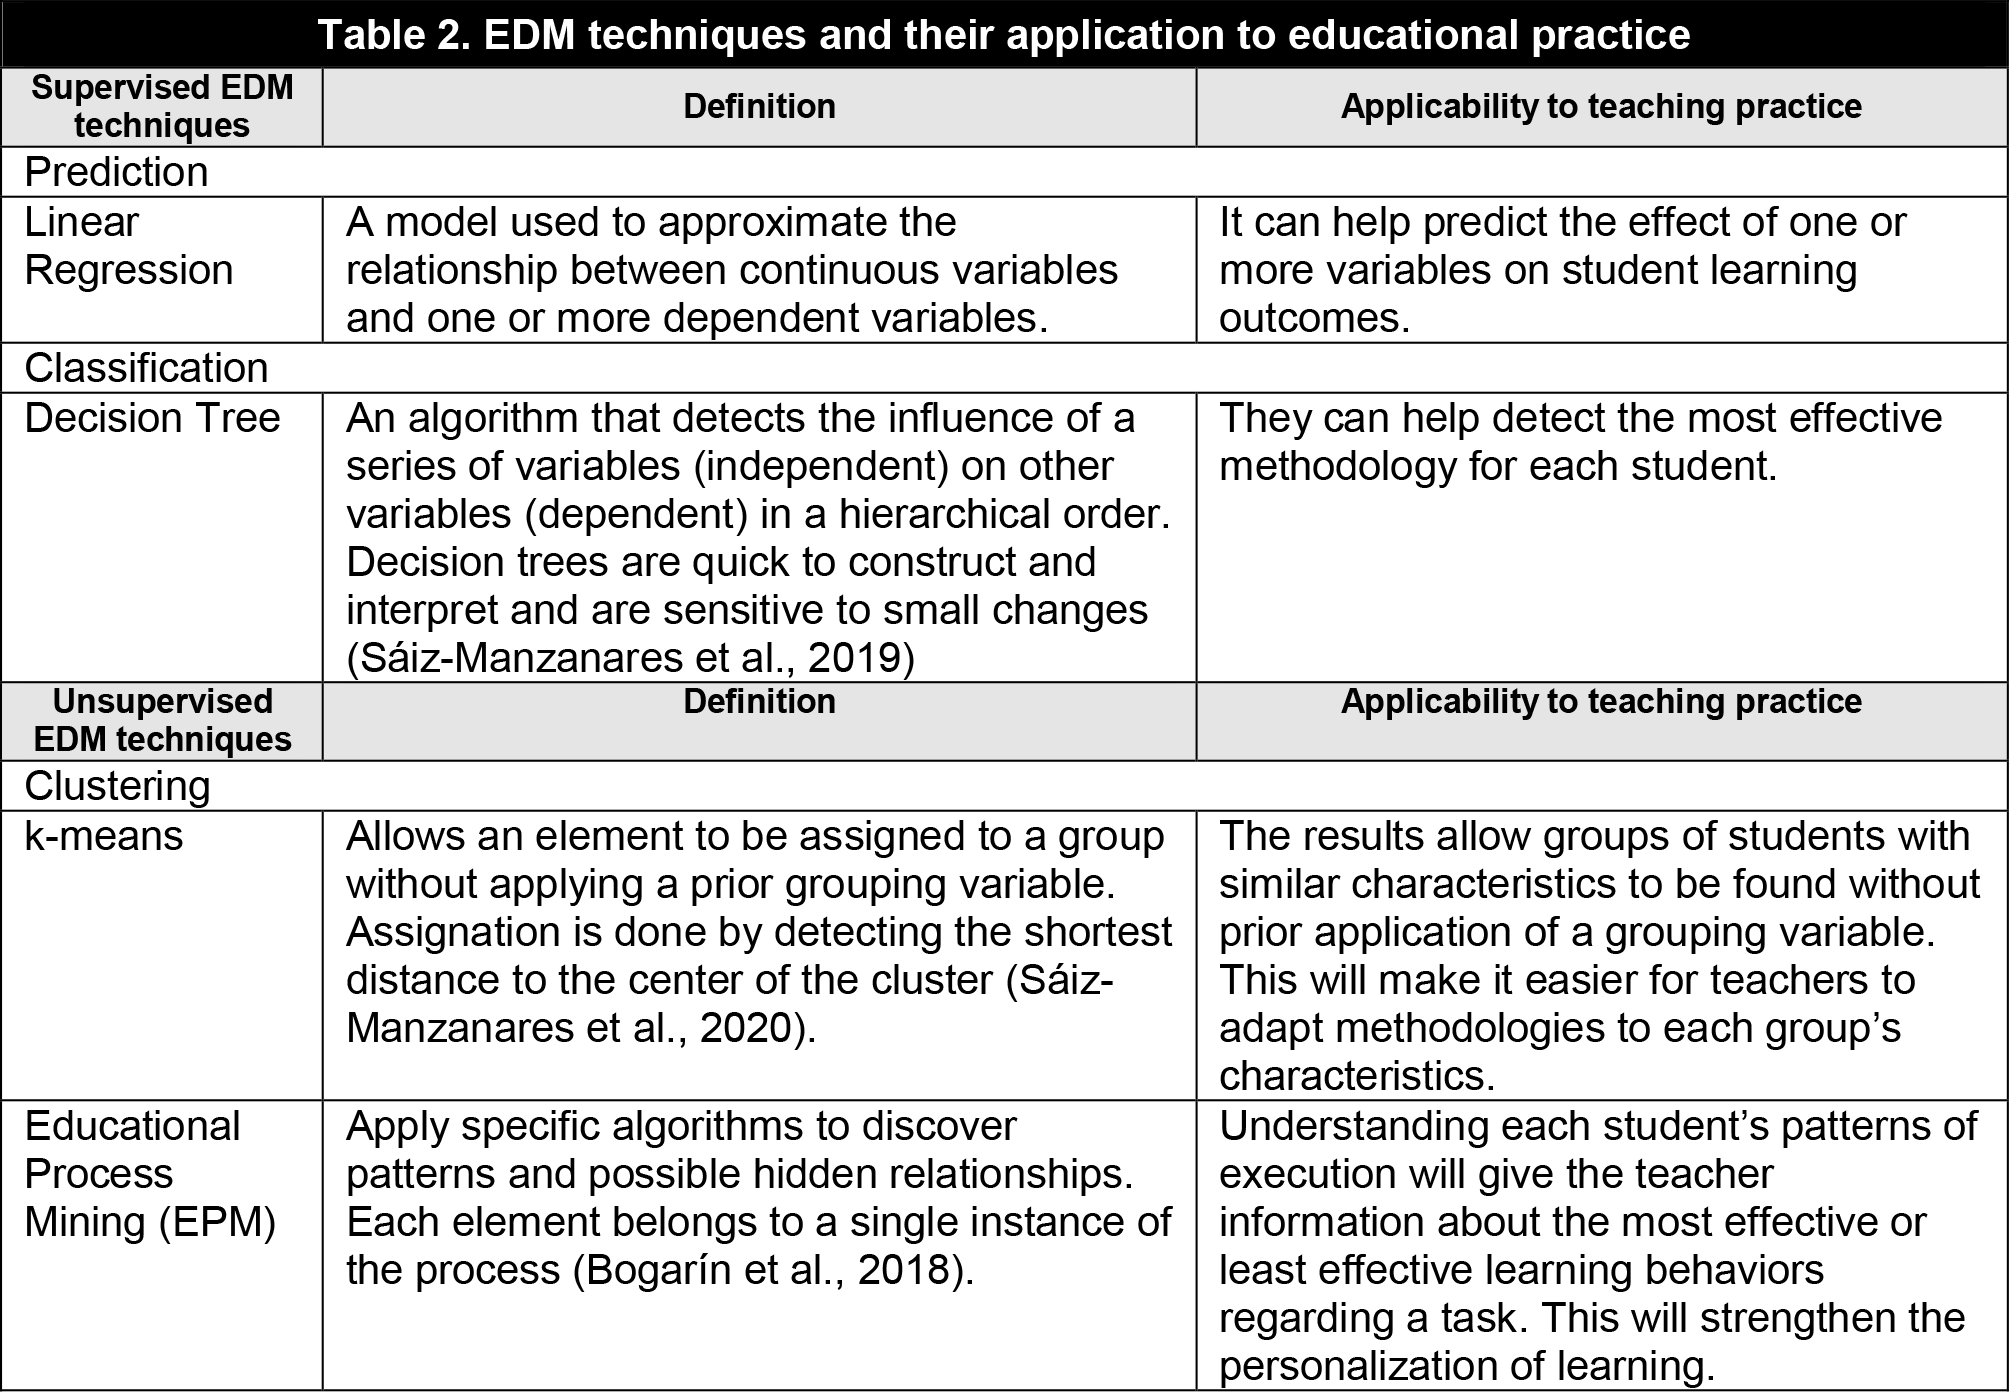
EDM techniques can be defined as the application of Data Mining (DM) techniques in an educational setting (Chango et al., 2022). More specifically, DM techniques use some Automated Learning techniques. These may be supervised, which include prediction (Seinen et al., 2022) and classification techniques (Díez-Pastor et al., 2014); or unsupervised, which include clustering (Sáiz-Manzanares et al., 2021a). Table 2 gives an overview of the most important EDM techniques in the education field.
Does the use of eye-tracking technology present new ethical challenges in the teaching-learning process?
Clearly, making records that include student activity during tasks brings with it ethical challenges. These center on the necessary authorization from the student to participate in this type of teaching. Students might have misgivings about granting this authorization as it means recording a task and might include images of them. This means that a procedure of this kind might introduce biases due to authorization from some students and not others because the students who do participate will get feedback to improve their learning processes while others will not. That will clearly lead to a situation with an equality gap in the pedagogical intervention which may cause increased differences in academic performance between students who do and do not participate. In summary, eye-tracking technology is promising in the field of education as it allows teachers to produce data about how their students process information. By analyzing that data, teachers can also identify the patterns of behavior during learning. All this information will presumably help teachers to personalize the design of learning tasks, which will facilitate education tailored to the needs of each student. This will enhance attention to diversity and foreseeably promote better academic inclusion. Based on all of the above, the research questions (RQ) for the present study were:
-
RQ1: Will there be significant differences between students with and without prior knowledge in the parameters of cognitive load (FC, FD, SC, PD, VC) and in the learning outcomes (LO)?
-
RQ2: Will there be clusters of patterns in learning behaviors that are different between students?
-
RQ3: Will the study find patterns of learning behaviors that are more effective and less effective?
Materials and methods
Participants
The study used a non-probabilistic convenience sample (based on agreeing to participate in the study) of 20 university students from three universities: 7 from the University of Burgos (UBU) (3 women Mage=22 years, SDage=2.00; 4 men Mage=21 years, SDage=1.41) 11 from the University of Valladolid (UVA) (8 women Mage=22.38 years, SDage=2.77; 3 men Mage=24 years, SDage=1.00), and 2 from the University of Miño in Portugal (UMINHO) (2 women Mage=21.50 years, SDage=0.70). The students were identified as with or without prior knowledge based on the knowledge branch of the course they were studying. Those studying Art History (n=7) were considered to have prior knowledge, whereas those studying Psychology (n=5) and Education (n=8) were considered not to have prior knowledge.
Instruments
a) Tobii Pro Lab version 1.194.41215 and a 15.6-inch monitor with a resolution of 1920 X 1080, at 64 Hz. Static metrics in this study were analyzed using SPSS software v. 28 (IBM, 2022). Dynamic metrics were recorded via the gaze point offered by Tobbi and Orange 3.33.0 was used to produce the heat maps.
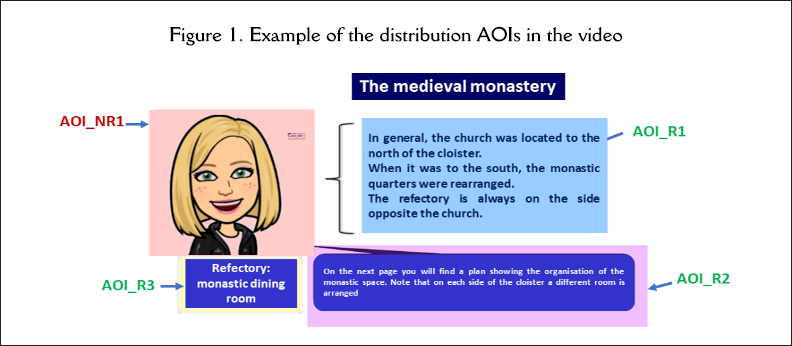
b) The stimulus for the eye-tracking technology was a self-regulated video about the development of monasteries in Europe. A recorded voice read out information, putting stress on the most important data. The video also included diagrams and pictures summarizing the most important content. The information for the video was taken from the “SmartArt Toolkit for Knowledge Transfer” which can be found at https://bit.ly/3CPkEwq. The SmartArt project was co-financed by the European Union (information about the project can be found at http://bit.ly/3kLeF5J). The video used in the study is available at http://bit.ly/3VzdMd9. The video contains 1 non-relevant AOI—AO1_NR1— (an image of an avatar) and 3 relevant AOIs: Relevant AOI 1 (AOI R1; an outline of important concepts); Relevant AOI 2 (AOI R2; summary of the most important spoken content); and Relevant AOI 3 (AOI R3; key concepts from the spoken information). An example showing the distribution of the AOIs is given in Figure 1.
c) Knowledge test about the concepts seen in the video. This test consists of 9 questions about the most important concepts in the video. The questions were taken from the “SmartArt Toolkit for Knowledge Transfer” and were the first 9 questions from “Self-assessment questionnaire 1. Basic level” (p. 63-64), which can be found at https://bit.ly/3CPkEwq.
Procedure
Before carrying out the study, approval was obtained from the UBU Bioethics Committee (IR 27/2019). Following that, students at UBU, UVA, and UMINHO were offered the chance to participate in the study. Students who agreed signed their informed consent to participate voluntarily and without remuneration. The experimental phase was carried out with each student individually in two classrooms (one in UBU, the other in UVA) with controlled lighting conditions and without distracting stimuli. The experiment was performed in all cases by the same researcher who was an expert in the use of this technology.
Research design
This study was exploratory. To test RQ1, given the characteristics of the sample, we applied a quasi-experimental design without a control group where the independent variable was “prior knowledge of art history” and the dependent variables were the parameters of cognitive load and the learning outcome. To test RQ2 and RQ3 we applied a descriptive design (Campbell & Stanley, 2005).
Data analysis
Because non-probabilistic convenience sampling was used, and because the sample was smaller than 30 participants, we used non-parametric statistics to test the RQs. For RQ1, we used the Mann-Whitney U test and calculated the non-parametric effect size r, with the cutoff points: (a) up to 0.30, small; (b) from 0.30 to 0.50, moderate; (c) over 0.50, high. This analysis was done using SPSS v. 28 (IBM Corp, 2022). For RQ2 we used k-means clustering using SPSS v. 28 (IBM Corp, 2022) along with visualization using heat maps and clustering using Machine Learning and data visualization from the Orange toolbox 3.33.0 (Demšar et al., 2013). Finally, for RQ3, we used the visualization of gaze point patterns offered by Tobii Pro Lab version 1.194.41215.
Analysis and results
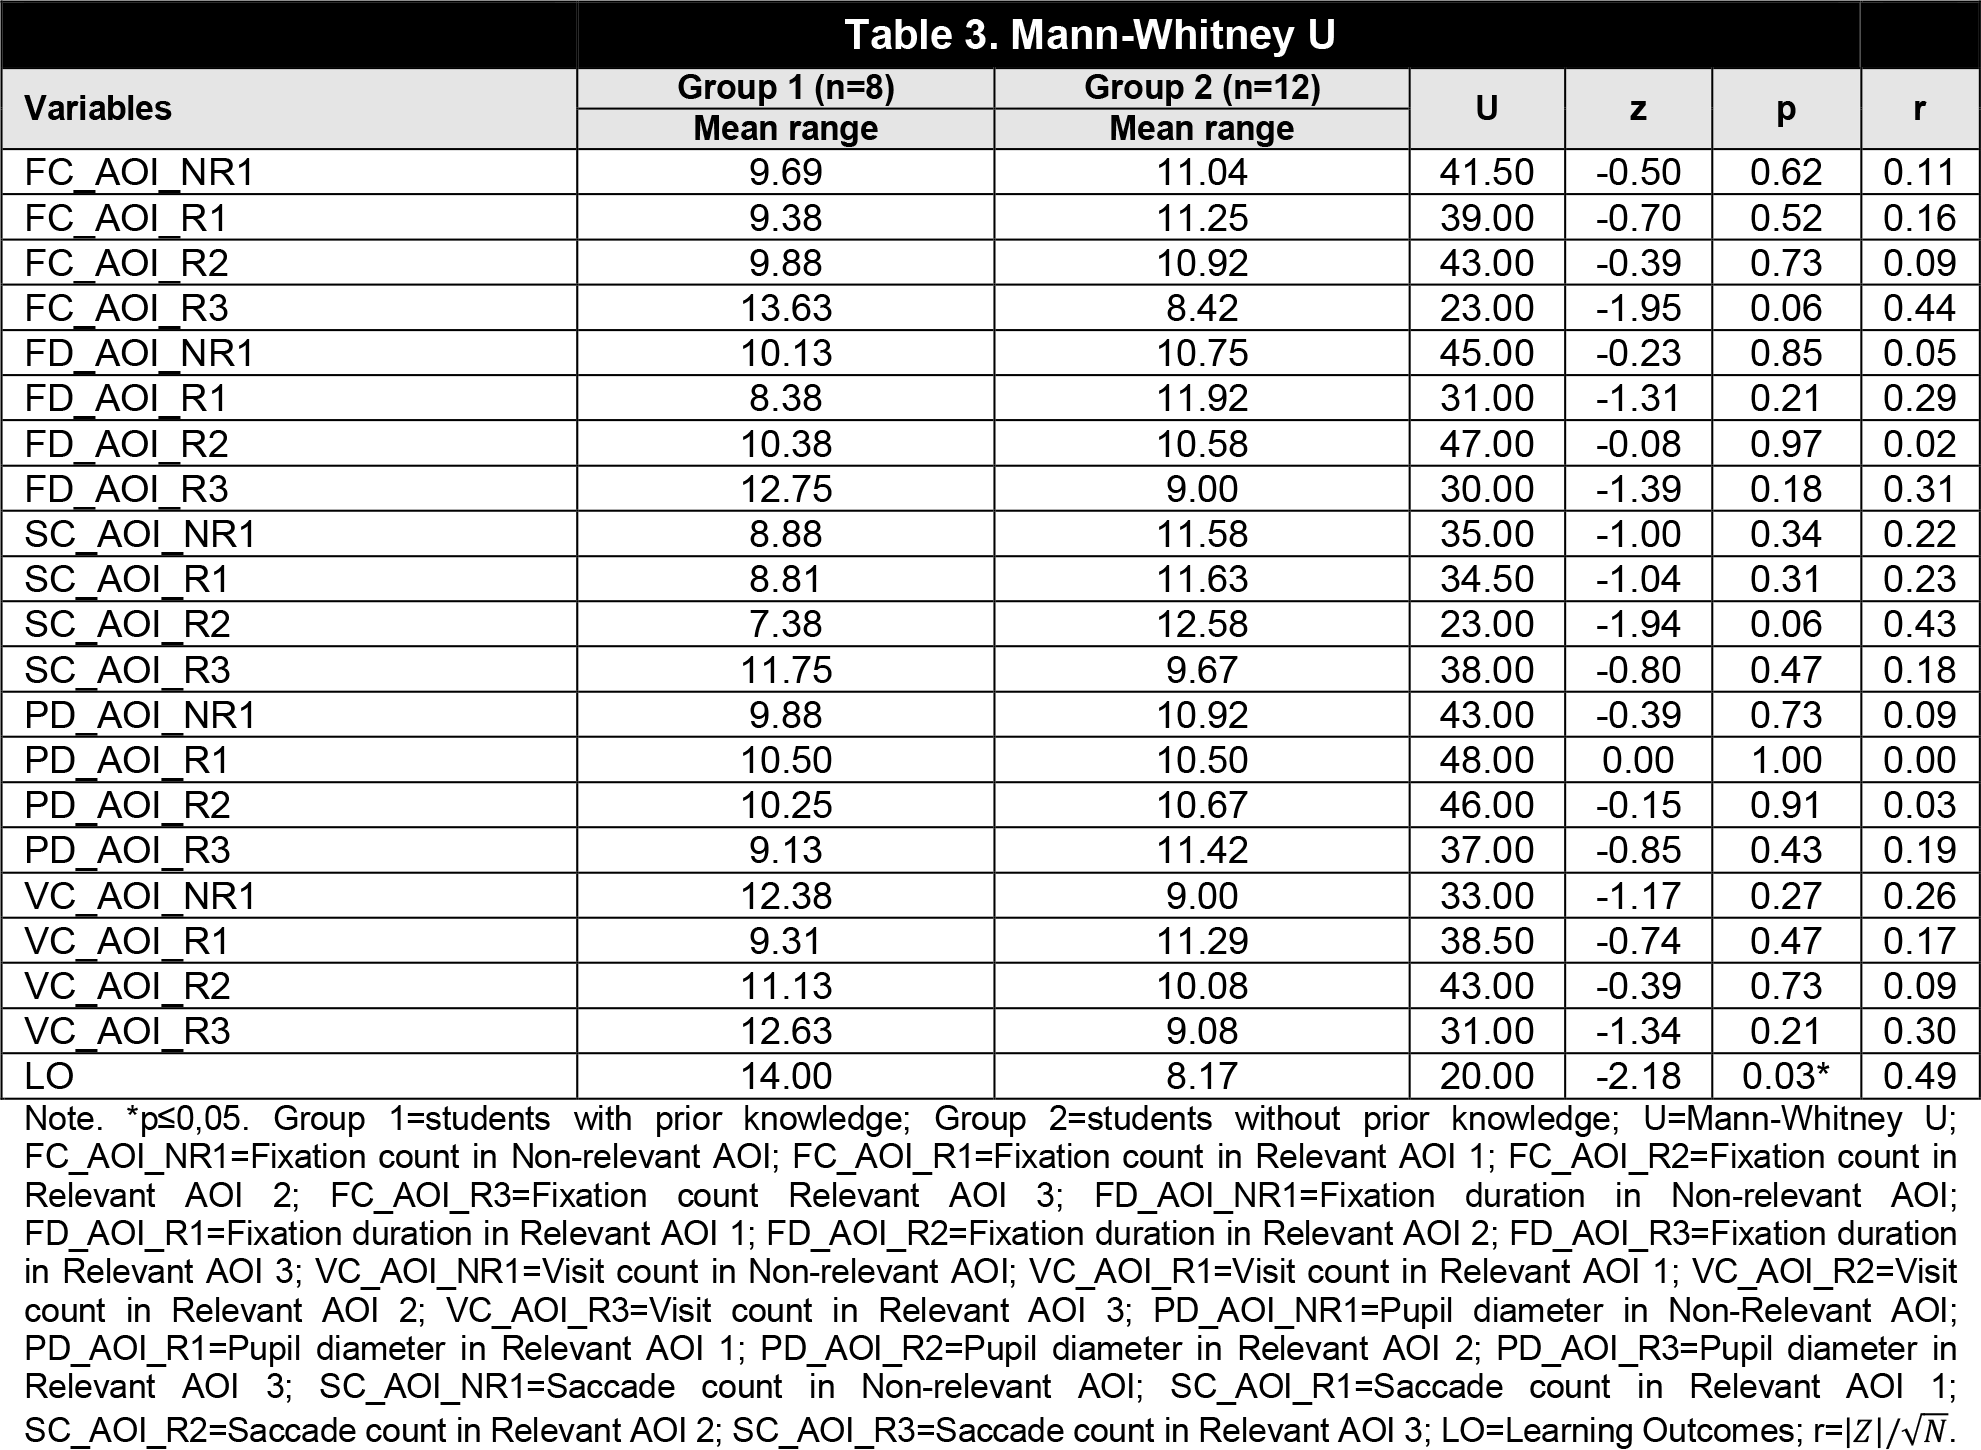
There were no statistically significant differences between students with or without prior knowledge in terms of the cognitive load parameters (FC, FD, SC, PD, VC). However, there was a slight difference (p=0.06) in SC_AOI_R2 (this parameter refers to the saccade transition in the summary of the most important spoken content). There were also significant differences between the two groups in learning outcomes [U=20, p=0.03] with a moderate effect size, r=0.49. The students with prior knowledge had higher scores (Median (Mdn)=5) than students without (Mdn=2). See Table 3.
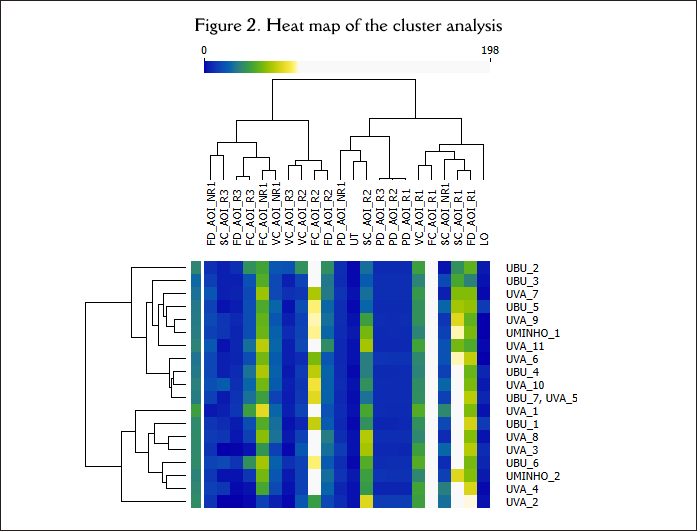
To test RQ2, we performed a cluster analysis using the k-means algorithm. Beforehand, we used the elbow method to estimate the number of clusters (the results are available at https://bit.ly/3W0Qe0Q). Two clusters were found regarding the variables considered in Table 3.
Figure 2 shows a visualization of the distribution of students in each cluster. The k-means unsupervised machine learning technique provides a visualization of each student’s position in each cluster without the prior application of a grouping variable. This allows grouping variables to be detected that have not been established previously. The cluster analysis is available in Table 4 on the Figshare platform (http://bit.ly/3JiNrNf). An ANOVA test between the clusters found significant differences in: FC_AOI_R1 (F=12.98, p=0.00), with the higher scores in cluster 2—indicating that the students in this cluster may have had difficulty in discriminating between relevant and non-relevant information in the task; FD_AOI_NR1 (F=9.79, p=0.01), with higher scores again in cluster 2—indicating that the students in this cluster paid more attention to the information in the non-relevant AOI; FD_AOI_R1 (F=10.13, p=0.01), with higher scores in cluster 1—which may be an indicator that these students paid more attention to this stimulus; VC_AOI_R1 (F=5.74, p=0.03), with higher scores from students in cluster 1—which may indicate greater interest from these students in Relevant AOI 1; SC_AOI_NR1 R1 (F=14.55, p=0.00), with more saccades from students in cluster 1—this may be explained from greater use of guidance responses in these students which may be related to greater cognitive effort discriminating between relevant and non-relevant information; and SC_AOI_R1 (F=22.43, p=0.00), there were more saccades from students in cluster 1—which may be related to greater cognitive effort in these students in relation to the information in Relevant AOI 1. Lastly, it is worth highlighting that there was a tendency towards difference in FD_AOI_R2 (p=0.05) and FD_AOI_R3 (p=0.05). FD was longer in students in cluster 2, which may be an indicator of greater cognitive effort in relation to the information in Relevant AOIs 2 and 3.
In response to RQ3, we performed a visualization analysis of students’ learning behavior patterns considering the results of the cluster analysis (Figure 2).
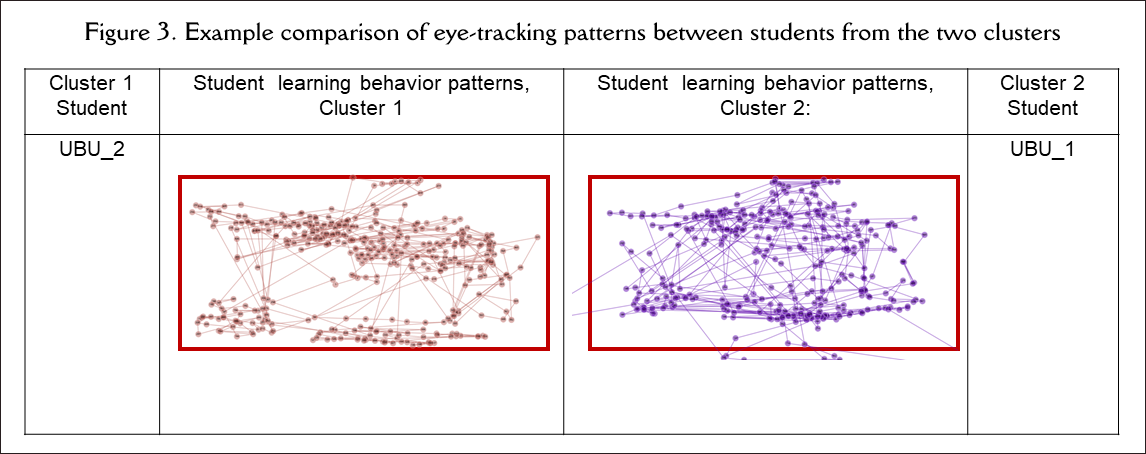
As an example, we present a comparison of the gaze point. Between a student in cluster 1 and a student in cluster 2 (Figure 3). In the comparison, the path followed by the cluster 1 student deviates slightly from the way the cluster 2 student tracks the information presented in the video. The cluster 2 student’s path is more spread out (the gaze path strays outside the frame where the information is presented).
Discussion and conclusions
Neurotechnological resources such as eye-tracking technology offer teachers a range of promising opportunities in the 21st century. These include recording learning behaviors in various types of tasks. Eye-tracking technology in particular offers information about students’ attention and cognitive effort (Asadi et al., 2022; Kulomäki et al., 2022; Rodziewicz-Cybulska et al., 2022; Taub & Azevedo, 2019) during tasks (Ollesch et al., 2021). It can also record students’ learning behaviors regarding relevant and non-relevant information in AOIs that the teacher defines beforehand, along with information about each student’s patterns of task resolution (Coskun & Cagiltay, 2022; Merchie et al., 2022; Tsai et al., 2022). Teachers can then determine the most and least effective patterns for each task (Feng & Law, 2021; McLeod et al., 2022; Ollesch et al., 2021; Tsai et al., 2022; Yang & Wang, 2023). Effectiveness will be determined based on each student’s learning outcomes, and such a comparison could serve as a reference for teachers to create personalized learning (Sáiz-Manzanares et al., 2021b). This is a notable step forward as it mitigates the subjectivity that might be associated with observing learning processes in natural contexts without using such technology and measuring resources. However idyllic this achievement may seem; it is not without its handicaps. Although the technology of eye-tracking has advanced in terms of functionality, it still needs EDM techniques to be used for the interpretation of the records (Chango et al., 2022; Feng & Law, 2021). This is a challenge for teachers or for institutions that wish to use it.
This study demonstrated an example of how eye-tracking technology works in analyzing university students’ learning processes from watching a video and how it relates to learning results. In summary, the results indicate that prior knowledge did not seem to be important in a self-regulated video task in terms of cognitive load parameters but were important in terms of learning outcomes. This finding is in line with the studies by Fiorella (2022). Nonetheless, we did find that other variables that had not been previously defined did seem to influence the indicators of cognitive effort (FC, FD, SC, PD, VC). Students in one of the clusters seemed to use more techniques of reflection and focused their attention on the more relevant information, inhibiting the less relevant information, unlike the other group, who seemed to have more problems focusing attention on the relevant information. More specifically, these differences appeared in the AOI defined as non-relevant and one relevant AOI related to the outline information. These results are important for the teacher, as they can offer guidance about how to produce teaching materials that are better tailored to the learning characteristics identified in each of the clusters.
Future studies should analyze the characteristics of the students assigned to each cluster in order to detect the variables that can explain the clustering. In addition, this study has demonstrated an example of the detection of learning behavior patterns in different types of students that had previously been grouped together. This is significant functionality for teachers, as studying each pattern will help us understand where each student’s difficulties with learning lie, and based on that, the teacher will be able to offer individual guidance to each one (Chango et al., 2022; Molina et al., 2017; Sáiz-Manzanares et al., 2021b). Nonetheless, the results of this study must be taken with caution, as it used a small convenience sample, meaning that generalization of the results is limited, although the ultimate aim of this study was to demonstrate possible applications and challenges of using eye-tracking technology in a university education setting. In summary, analyzing the data collected by eye-tracking technology offers great potential for precision teaching, but there is still a long way to go before it can be implemented smoothly in natural settings. (1)